2024 Crypto Adoption and Illicit Exposure Report
Discover which countries lead in crypto adoption — and where illicit risks were highest in 2024
Key takeaways
- India, Indonesia, Nigeria, the United States, and Vietnam are the top five countries leading crypto adoption year to date in 2024.
- Kenya has seen the largest increase in crypto adoption (now at #17 vs. #32 in 2023), doubling its crypto transaction volume from 2023.
- North Korea, Nigeria, Georgia, the Philippines, and Russia are the top five countries with the highest percentage of illicit exposure for entities primarily located in their jurisdictions.
- The top ten countries for illicit exposure are largely driven by the exposure of their entities to sanctions or fraud and scams, which globally represent the largest illicit volumes on the blockchain.
{{premium-content_chapter-divider}}
Methodology
Our Country Crypto Adoption Index aims to capture the penetration of cryptocurrency usage in different countries, while taking into account the country’s overall economic conditions.
We approximate the adoption of cryptocurrencies in each country by combining our proprietary on-chain data with web traffic data.
Apportioning on-chain volumes for crypto intermediaries
We start with the on-chain incoming volume of different types of crypto intermediaries (e.g. exchanges, DeFis, payment services, etc.). We then apportion the on-chain incoming volume of a specific crypto intermediary to individual countries, according to how much web traffic to the crypto intermediary originates from each country.1
The resulting metric provides an estimation of the geographic distribution of cryptocurrency activity facilitated through intermediaries, based on on-chain incoming volumes and web traffic patterns, and serves as a proxy for incoming volume to crypto intermediaries attributed to each country.2
Accounting for global economic conditions
To account for differences in economic conditions across countries, we adjust the previously calculated incoming volume to crypto intermediaries in each country by scaling it with the country’s GDP per capita.3 This adjustment helps contextualize the volume in terms of the country’s economic capacity and payment activity.
For example, USD 1 of incoming crypto volume in a country where the average annual payment per person is USD 100 has a much greater relative significance than the same amount in a country where the average annual payment is USD 10,000. In the first case, crypto activity represents a larger share of the country’s overall payment volume, suggesting higher crypto adoption relative to its economic size.
By applying this scaling, we refine the previously calculated metric of incoming volume to crypto intermediaries to better reflect crypto adoption in each country. The scaled on-chain incoming volume highlights the relative adoption of crypto within the context of each country’s economic conditions.
Finally, all countries are ranked based on this scaled on-chain incoming volume as a proxy for their crypto adoption.
Measuring illicit crypto exposure
While the Country Crypto Adoption Index focuses on user-driven adoption, the Country Illicit Crypto Exposure Index evaluates the on-chain exposure of entities primarily based in a given country to illicit activities.4
Key dimensions of illicit exposure
Our analysis measures illicit crypto exposure across two dimensions:
- Ownership exposure: Ownership exposure accounts for addresses owned by entities within a country that are directly associated with illicit activity. If an address controlled by an entity based in a country is engaged in illicit activity, it contributes to the country's ownership exposure.
- Counterparty exposure: Counterparty exposure reflects transactions between entities in a country and illicit addresses. Transactions with illicit addresses — whether related to sanctions, scams, or other violations — contribute to this dimension of exposure.
Categories of illicit activity
TRM’s methodology categorizes addresses as illicit based on their association with specific types of illicit activity, including but not limited to:
- Hacked or Exploited Funds: Events and addresses associated with hacked or exploited funds
- Scams and Fraud: Addresses or entities associated with scams and fraud
- Sanctions: Addresses or entities which have been designated by governments
- Note: This report assumes a US sanctions lens and only considers counterparty exposure to entities and jurisdictions sanctioned by the US
- Blocklisted: Addresses that appear on public blocklists of stablecoin issuers, trusted law enforcement agencies’ advisories and alerts, and VASP or community-driven organization alerts that serve the purpose of informing other entities of the risk associated with published addresses
Each illicit address is attributed through TRM’s proprietary intelligence collections, partnerships, and advanced analytics.
Focusing on proportion of illicit activity
The aggregated volume of illicit activity in each country is scaled relative to the total transaction volume of entities in the country. This scaling provides a proportional view of illicit exposure, ensuring that high-volume jurisdictions are not disproportionately impacted in the rankings.
Contextualizing iIllicit crypto exposure
Rankings in the Country Illicit Crypto Exposure Index aim to describe a country’s exposure to illicit crypto activity, in relation to the on-chain crypto volume of entities based in that jurisdiction. This methodology means that countries with a smaller number of entities (or entities with lower transaction volumes) may rank higher than countries with a larger number of entities given the same amount of illicit crypto exposure.
These rankings are not definitive assessments of a country's anti-financial crime framework, regulatory capabilities, or overall financial integrity. Rather, this analysis aims to offer actionable insights, empowering stakeholders — including virtual asset service providers, regulators,policymakers, and law enforcement — to identify areas of risk, strengthen safeguards, and collaboratively foster a more secure and transparent global financial ecosystem.
1 We measure web traffic by the number of visits from both desktop and mobile devices to an entity’s URL, adjusted for bounced visits.
2 The metric includes transactions across more than 20 blockchains, including Bitcoin, Ethereum, Arbitrum, Solana, Binance Smart Chain, TON, and all tokens on these chains with available pricing data.
3 We use purchasing power parity based GDP per capita to account for differences in cost of living in different countries. Guidance for VASPs, Part 3, Paragraphs 125-128.
4 Our approach to determining the primary location for VASPs is informed by FATF 2021 Updated Guidance for VASPs, Part 3, Paragraphs 125-128.
{{premium-content_chapter-divider}}
Country Crypto Adoption Index 2024
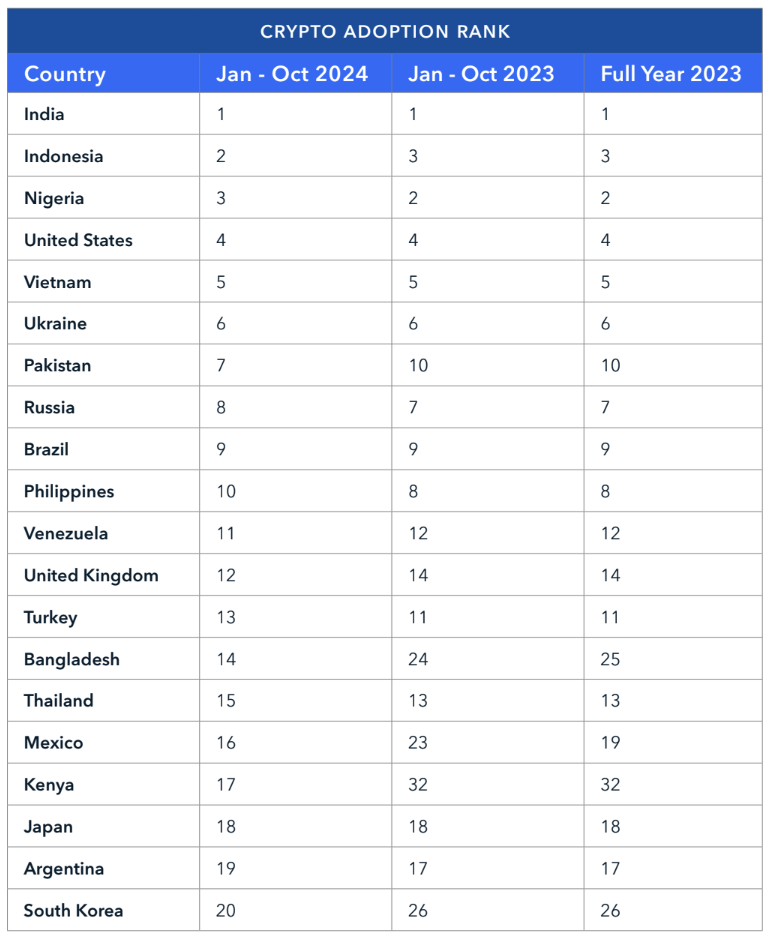
The top 20 countries below represent those that have the highest rate of crypto adoption in 2024 by exposure through intermediaries.
<span class="premium-content_chapter">KEY TREND #1</span>
The top 10 countries with the highest crypto adoption remain the same as in 2023
The countries in the top ten for highest crypto adoption have remained the same in 2024 as they were in 2023. Five countries in Asia (India, Indonesia, Vietnam, Pakistan, and the Philippines) made the top ten list, more than any other region.
India continues to lead in crypto adoption. WazirX, India’s largest centralized exchange, has indicated continued growth and adoption throughout India over the past several years. In its last transparency report, the exchange noted that it experienced its highest sign up rates to date in December of 2023, and its highest trading volume in March of 2024.
Indonesia ranks #2 in 2024, overtaking Nigeria (now in the #3 spot). Indonesia’s ascent is largely driven by a massive increase in the crypto volume received by users in the country, with volume more than doubling in the first ten months of 2024 compared to the same period in 2023. This could be driven by a growing number of crypto investors as well as favorable market conditions.
Notably, the United States remains at #4 in 2024, even though users in the US received over 50% more crypto volume in 2024 than during the same period in 2023.
<span class="premium-content_chapter">KEY TREND #2</span>
Bangladesh, Kenya, and South Korea enter the top 20 — while France, China, and Canada exit
Bangladesh, Kenya, and South Korea are the newest entrants in the top 20 list.
Kenya is the country that saw the largest bump in its ranking: climbing from #32 in 2023 to #17 in 2024. Kenya has received more than USD 51 billion in crypto volume so far in 2024, compared to USD 23 billion in the same period in 2023. Kenya’s strong mobile money culture, entrepreneurial ecosystem, and adoption of stablecoins to combat volatility and inflation in local currency have all likely contributed to its growing crypto adoption.
Meanwhile, France (#21), China (#23), and Canada (#24) dropped out of the top 20 in 2024. While all of these countries saw a slight increase in their crypto volume received, their growth has been dwarfed by other faster growing countries.
{{premium-content_chapter-divider}}
Country Illicit Crypto Exposure Index 2024
While TRM’s Country Crypto Adoption Index aims to provide a view of the countries with the highest rates of crypto adoption, our Country Illicit Crypto Exposure Index aims to provide a view of the countries with the highest proportion of illicit crypto exposure relative to the total on-chain volume of entities primarily located in those countries.
The below ten countries represent those that have the highest proportion of illicit crypto exposure through the entities that are primarily located in those countries.
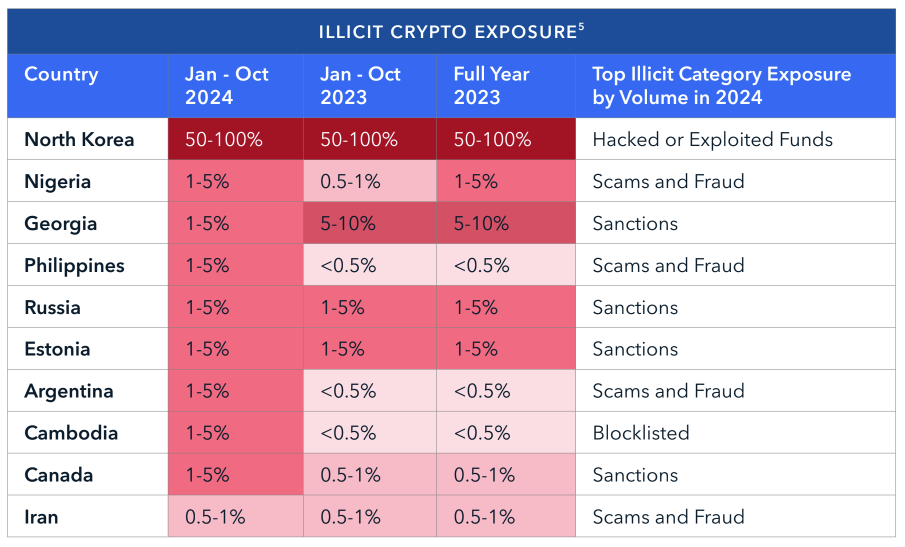
5 Countries with < USD 1 million of illicit exposure are excluded from the list.
<span class="premium-content_chapter">KEY TREND #3</span>
North Korea and Nigeria are countries with highest rate of illicit activity in crypto
North Korea and Nigeria are the two countries with the highest relative proportions of illicit crypto exposure from January through October 2024.
The total crypto volume received and sent by entities in North Korea are largely directly linked to hacked and stolen funds by North Korean hacking groups. Nigeria’s on-chain illicit volume is largely driven by scams and fraud exposure — predominantly through one high-volume entity involved in a range of scam activities.
<span class="premium-content_chapter">KEY TREND #4</span>
Sanctions drives illicit exposure for 4 out of top 10 countries in illicit crypto exposure index
Georgia, Russia, Estonia, and Canada all have illicit crypto exposure to sanctions driven by entities located in their jurisdictions transacting with sanctioned entities. In many of these cases, these transactions are with sanctioned Russian entities, including services such as Garantex and Cryptex.
<span class="premium-content_chapter">KEY TREND #5</span>
5 new countries enter the illicit crypto exposure index top 10 in 2024, driven by significant increase in illicit volume
Nigeria, the Philippines, Argentina, Cambodia, and Canada have emerged as new entrants to the top ten countries on the Illicit Crypto Exposure Index.
For Nigeria, the Philippines, and Argentina, their increase in illicit crypto exposure was largely driven by exposure to scams and fraud schemes. However, the nature of their exposure varies. Nigeria predominantly has ownership exposure, indicating entities operating in Nigeria with direct involvement in scams and fraud schemes. The Philippines and Argentina both have counterparty exposure to scams and fraud. Entities in the Philippines have predominantly outgoing exposure to scams and fraud schemes, potentially indicating a relatively high amount of victim losses. Meanwhile, Argentinean entities’ crypto exposure to scam and fraud schemes is predominantly incoming exposure. This could be a result of scammers receiving funds at exchanges, or investors receiving returns from pyramid or Ponzi schemes.
{{premium-content_chapter-divider}}
Global crypto adoption’s impact on risk and regulation
This report offers a snapshot into how cryptocurrency adoption and exposure to illicit activities vary across countries.
With leading countries like India and Indonesia showcasing robust adoption rates, the report highlights regions driving legitimate use cases for crypto, as well as regions that present higher illicit exposures. By examining crypto flows, user adoption rates, and the presence of illicit activities, this report allows policymakers and law enforcement to better understand global trends and potential areas of risk. As illustrated by the changes in rankings and growth in illicit crypto volumes across new countries, international collaboration between regulators, law enforcement, and crypto services is needed to effectively combat crime.
Tailored regulatory approaches to foster secure and innovative crypto use cases while identifying areas that may need stronger oversight and operational strategies will allow for continued innovation and adoption of digital assets in a shifting global landscape.
{{premium-content_chapter-divider}}
About TRM Labs
TRM Labs provides blockchain analytics solutions to help law enforcement and national security agencies, financial institutions, and cryptocurrency businesses detect, investigate, and disrupt crypto-related fraud and financial crime. TRM’s blockchain intelligence platform includes solutions to trace the source and destination of funds, identify illicit activity, build cases, and construct an operating picture of threats. TRM is trusted by leading agencies and businesses worldwide who rely on TRM to enable a safer, more secure crypto ecosystem. TRM is based in San Francisco, CA, and is hiring across engineering, product, sales, and data science. To learn more, visit www.trmlabs.com.


