2025 Crypto Adoption and Stablecoin Usage Report
An overview of digital asset adoption across global jurisdictions in the first half of 2025
Key takeaways
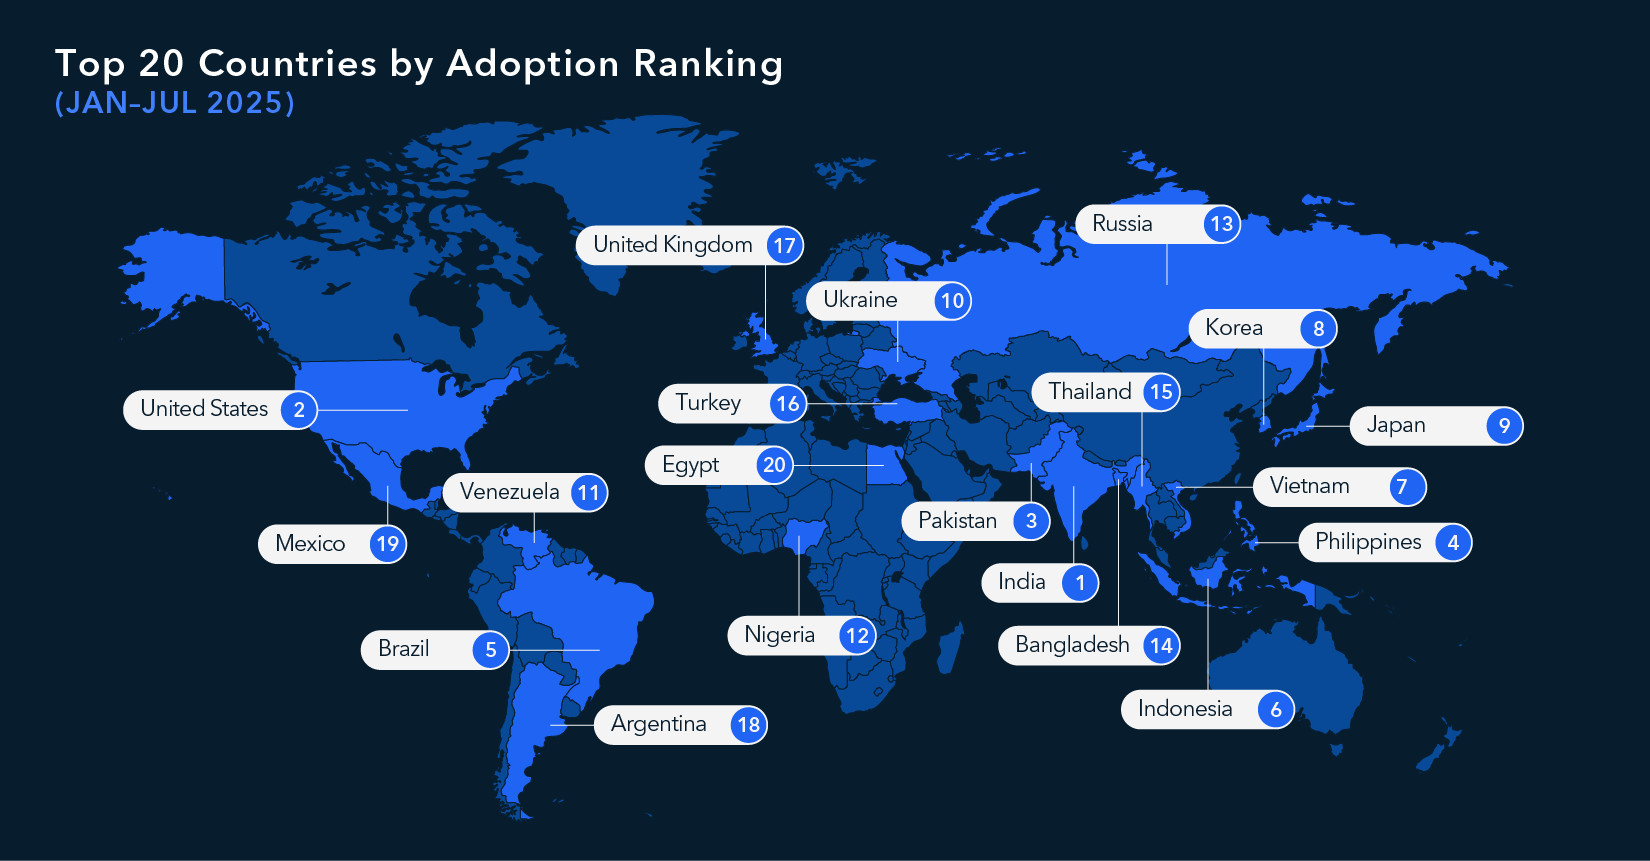
- Between January – July 2025, India, the United States (US), Pakistan, the Philippines, and Brazil ranked highest for crypto adoption globally.
- US crypto activity surged by around 50% between January and July 2025 compared with the same period in 2024, cementing its status as the largest crypto market globally in absolute terms measured by transaction volume.
- South Asia saw an acceleration in crypto adoption — becoming the fastest growing region for crypto adoption in 2025 (as of July 2025).
- Crypto adoption accelerated in North Africa, despite a ban in several countries.
- Stablecoins now comprise 30% of all on-chain crypto transaction volume, recording their highest annual volume to date in August 2025, reaching over USD 4 trillion for the year so far (an 83% increase on the same period in 2024).
- Between 2024 and 2025, sanctions drove illicit volume growth for non-stablecoin digital assets, while sanctions-related activity in stablecoins fell by 60%, indicating a potential shift away from stablecoins for sanctions evasion.
Methodology
TRM’s Country Crypto Adoption Index 2025 provides a ranking of digital asset adoption relative to the size of a country’s economy. It combines TRM’s proprietary on-chain transaction data with web traffic patterns analysis, before scaling to account for differences in economic conditions globally.
Changes from last year
This year’s methodology builds on the approach we took in 2024 by adjusting the way we measure on-chain activity.
Previously, DeFi-related flows represented a substantial share of the index, offering valuable insight into early adopter behavior. As the ecosystem has matured, however, the footprint of crypto activity has diversified, with more structured service providers and institutional participants shaping transaction patterns.
To capture this shift, in this report, we have isolated and analyzed activity from categories closely tied to organized or regulated services — such as exchanges, custodians, OTC desks, payment providers, hosted wallets, and P2P marketplaces — while excluding flows from categories primarily associated with open-ended DeFi experimentation (e.g. decentralized applications, gaming, collectibles, contract deployers).
This adjustment shifts the index from primarily DeFi-driven signals toward a more balanced view that captures the expanding ways in which users engage with institutions in the crypto ecosystem.
Apportioning on-chain volumes for crypto intermediaries
First, we look at incoming on-chain volumes of major virtual asset service providers (VASPs) — such as exchanges and payment services — restricting flows to assets with reliable pricing data. As on-chain transactions do not typically reveal where users are located, TRM uses web traffic as a proxy for geographic attribution. The share of visits to a VASP from each country is applied to that platform’s incoming transaction volume, providing an estimate of how activity is distributed across jurisdictions.
Accounting for global economic conditions
Raw transaction volumes can overstate adoption in higher-income economies. To address this, we scaled each country’s attributed volumes by its gross domestic product (GDP) per capita on a purchasing power parity (PPP) basis. This adjustment accounts for varying cost of living and income levels, recognizing that the same level of crypto activity has greater significance in some economic contexts than in others.
For example, one US dollar of crypto volume carries more weight in a market where average annual payments per person total USD 100 than it does in a market where annual payments per person reach USD 10,000. In the first case, crypto represents a larger share of overall payment activity, indicating relatively higher adoption once economic size is taken into account.
After conducting this analysis, we combined on-chain volumes, web traffic attribution, and economic scaling into a composite score. Countries are ranked according to this score, which reflects both the level of activity and its relative significance within each economy.
This methodology provides a consistent snapshot of where crypto adoption is highest globally — not only by absolute volume, but also in terms of local economic context.
{{premium-content_chapter-divider}}
Country Crypto Adoption Index 2025
TRM’s findings show that global retail-led adoption accelerated in 2025, as retail transactions rose by more than 125% between January – September 2024 and during the same period in 2025.
This rise in retail-led adoption indicates that individuals are playing an increasing role in shaping crypto’s evolution, with activity often tied to practical use cases such as payments, remittances, and preserving value in volatile economic conditions.
In line with this trend, we’ve also introduced a section on stablecoins this year, which have begun playing a more prominent role in the crypto ecosystem by offering users access to fiat currencies like the US dollar.
But first, let’s look at the jurisdictions with the highest levels of crypto adoption in 2025 — and what’s driving it.
* The rankings shown here for “Full Year 2024” differ from the rankings we originally published in our 2024 Crypto Adoption and Illicit Exposure Report (published December 2024) for two reasons:
- We updated our methodology — isolating and analyzing activity from categories closely tied to organized or regulated services while excluding flows from categories primarily associated with open-ended DeFi experimentation.
- The rankings shown here in the “Full Year 2024” column include a full year of data. Last year’s report analyzed data from January – October 2024.
US crypto volume increases by around 50% amid evolving regulatory landscape
The US maintained its #2 position in the index behind India, which remains #1 for the third consecutive year.
Our research shows that between January and July 2025, crypto transaction volume in the US rose by roughly 50%, compared with the same period in 2024, to over USD 1 trillion. This cements the US’s position as the largest crypto market globally in absolute terms (measured by transaction volume), building on the roughly 50% year-over-year increase observed in 2024 and highlighting that this growth is part of a sustained, multi-year trend.
What distinguishes this year’s surge is not just the magnitude, but the context. Our analysis suggests that the growth that began organically in 2023 and 2024 has been reinforced and accelerated by a combination of political, regulatory, and structural factors. These structural shifts have opened the market to new participants. Additionally, according to reporting by MarketWatch, regulated products like spot Bitcoin exchange-traded funds (ETFs) attracted nearly USD 15 billion in net inflows during the first half of 2025, signaling institutional demand.
This momentum has unfolded alongside a shifting political and regulatory environment in the US. President Donald Trump’s campaign was the first from a major US party to accept donations in cryptocurrency. Notably, President Trump's election in November 2024 appeared to spark a spike in crypto activity. TRM analysis shows that there was a 30% increase in US web traffic to VASPs in the six months following the election compared with the preceding period. Since taking office, President Trump has pledged to make the US “the crypto capital of the world.” Early actions followed:
- Congress passed the GENIUS Act, the first comprehensive stablecoin law
- The White House issued its 180-Day Digital Assets Report, providing a roadmap for agency action
- Lawmakers continued to advance the CLARITY Act, aimed at establishing a full market structure for digital assets
- The administration appointed the first national “crypto tsar” to coordinate policy across agencies, while the SEC launched a dedicated Crypto Task Force to guide oversight
As TRM has underscored in its analyses of the GENIUS Act, the White House report, and the CLARITY Act, these policy signals are creating clearer guardrails for adoption, capital flows, and market structure. The US market’s two consecutive years of double-digit expansion reflect not just enthusiasm, but the compounding effect of regulatory clarity and political commitment.
South Asia becomes the fastest growing region for crypto adoption
South Asia has emerged as the fastest-growing region for crypto adoption between January – July 2025, recording a 80% increase from the same time period in 2024 and reaching approximately USD 300 billion in transaction volume.
Looking at India (which ranks #1 for overall adoption) alongside the other two countries in the top 20 — Pakistan at #3 and Bangladesh at #14 — helps us understand the diverse set of motivations, market structures, and regulatory approaches shaping adoption in the region.
India’s position at the top is likely due to its large, young population’s rising interest in digital assets, supported by a crypto-fluent middle class and a thriving developer ecosystem. Interest in crypto as an asset class is also growing among institutional and high-net-worth investors, reinforcing India’s accelerating crypto adoption.
In Pakistan, soaring grassroots adoption has been further buoyed by key policy moves. In March 2025, the Pakistani government established the Pakistan Crypto Council to develop its blockchain and crypto ecosystem, and also announced plans to establish a dedicated crypto regulator, the Pakistan Virtual Assets Regulatory Authority (PVARA).
Although crypto remains illegal in Bangladesh, adoption continues through underground channels. Since 2014, Bangladesh Bank — the country’s central bank — has issued warnings about crypto use, citing potential violations of the Foreign Exchange Regulation Act. As of 2025, no platforms are licensed to operate legally in the country. However, ongoing capital controls and limited access to foreign exchange have made crypto an attractive option for individuals seeking alternatives to traditional financial systems.
Adoption persists in North Africa despite bans
In addition to Bangladesh, several North African countries also rank among the top 50 for adoption, despite formally banning or severely restricting cryptocurrency use:
- Egypt (#20)
- Morocco (#21)
- Algeria (#33)
- Tunisia (#42)
This underscores that, as noted by organizations like the Financial Stability Board and International Monetary Fund, blanket bans are ineffective and may in fact increase incentives for underground activity though channels like peer-to-peer (P2P) trading and over-the-counter (OTC) networks. Notably, the above jurisdictions outrank several countries with permissive or regulated frameworks — suggesting that grassroots demand for alternative financial tools can outweigh formal restrictions.
{{premium-content_chapter-divider}}
Stablecoin usage in 2025
Stablecoins are playing an expanding role in global crypto adoption. TRM analysis shows that stablecoins accounted for 30% of crypto transaction volume between January and July 2025. By pegging their price to a reserve asset such as fiat currency or commodities, stablecoins offer consistency amid the unpredictability of local markets in developing economies.
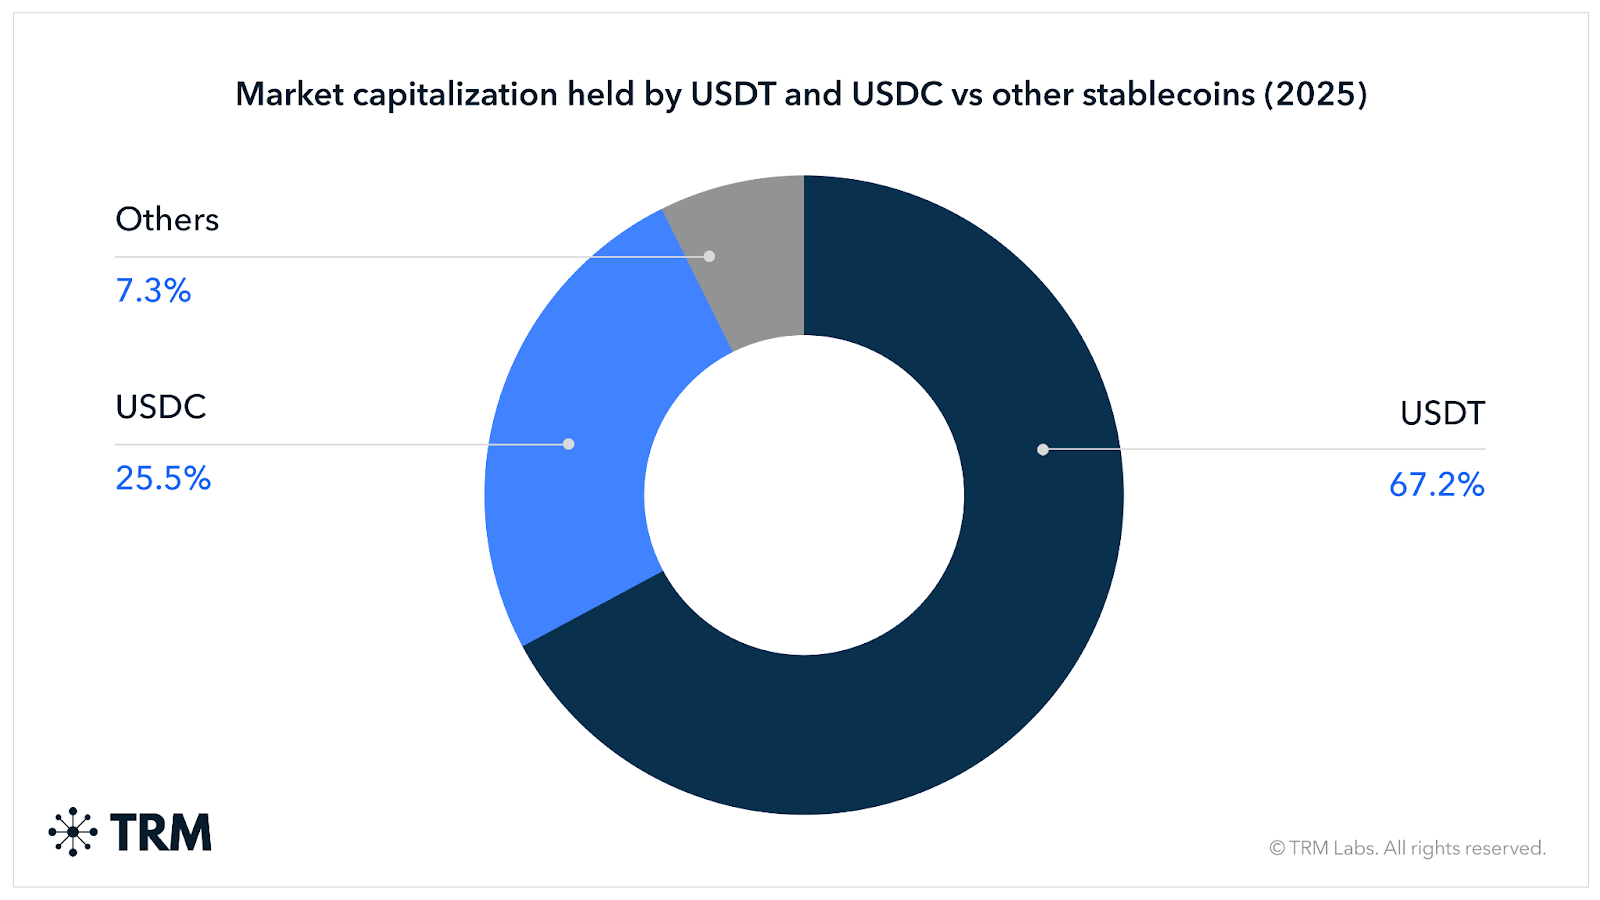
According to TRM analysis, more than 90% of fiat-backed stablecoins are pegged to the US dollar, with Tether (USDT) and Circle (USDC) accounting for 93% of the total stablecoin market capitalization. Regulation has also accelerated in 2025, with the US passing the GENIUS Act, Hong Kong passing its Stablecoin Bill, and the European Union’s Markets in Crypto Assets Regulation (MiCA) coming into effect.
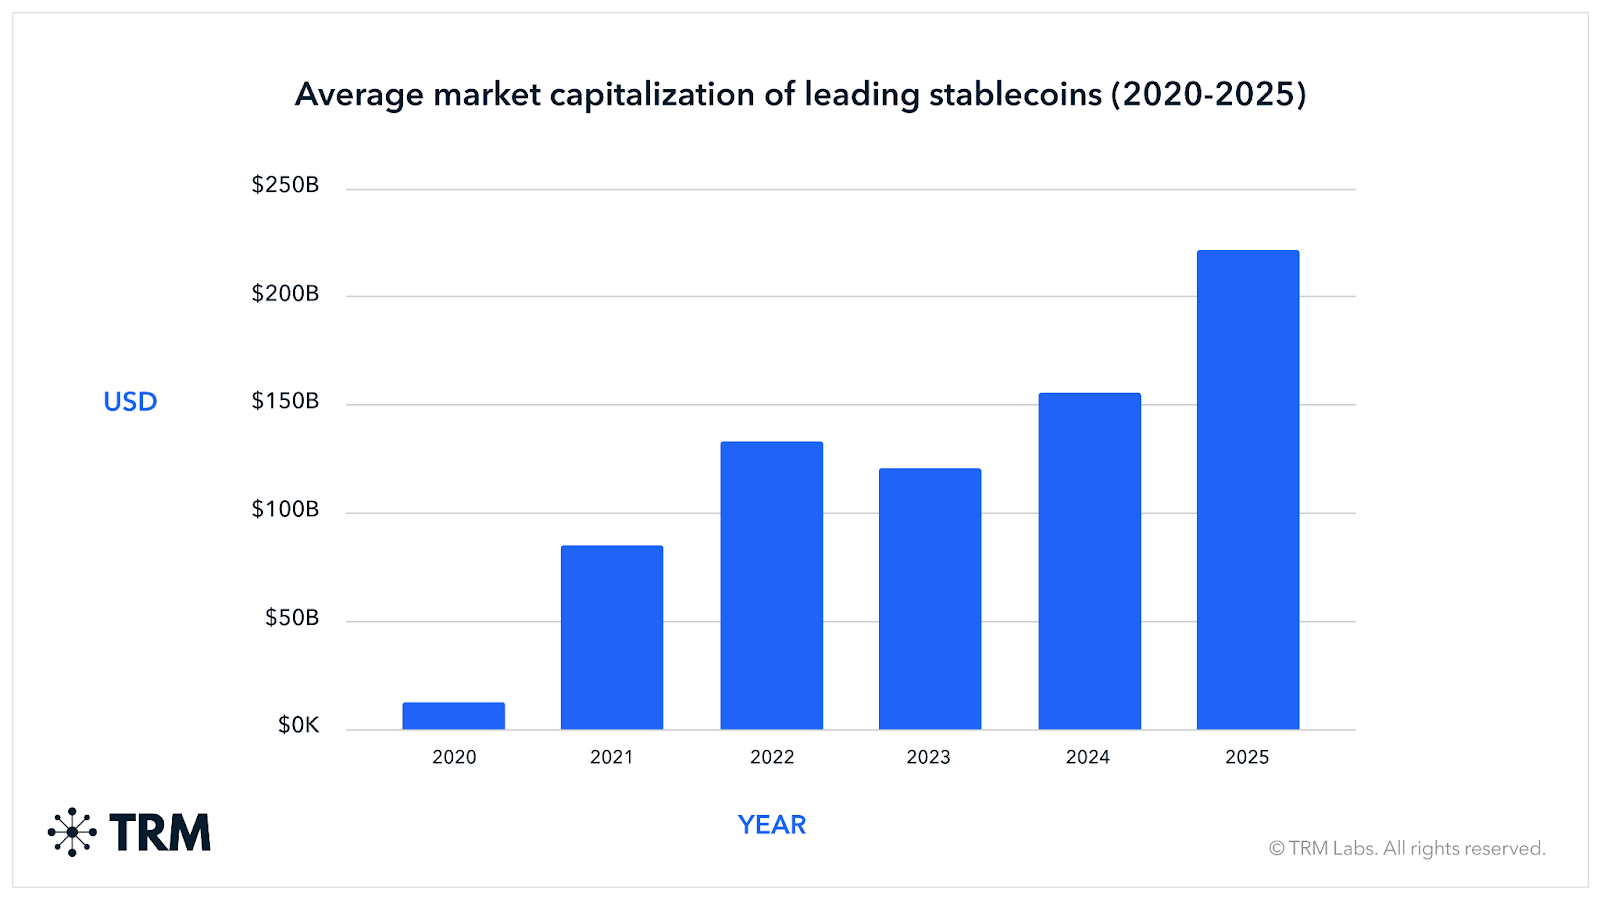
Stablecoin transaction volume reaches record high in 2025
As of August 2025, TRM analysis shows that stablecoins have reached their highest-ever annual transaction volume — rising 83% between July 2024 and July 2025, and reaching over USD 4 trillion in transaction volume between January 2025 and July 2025. Over the same period, leading stablecoins increased their share of the crypto market by 52%, underscoring their growing importance in the crypto landscape.
Although TRM assesses that 99% of stablecoin activity is licit, in the first quarter of 2025, stablecoin transaction volume accounted for 60% of illicit activity. This likely reflects the same underlying drivers that have made stablecoins attractive for licit activity, such as low transaction costs, speed, and broad availability on open blockchains like TRON and Ethereum.
.png)
For both leading stablecoins and the broader crypto ecosystem, investment fraud was the primary contributor to illicit volume growth between 2024 and 2025. However, when stablecoins are excluded from the analysis, sanctions drove the largest increase for digital assets, rising by more than USD 1 billion compared with 2024.
This stands in sharp contrast to the USD 5.2 billion decline in sanctions-related volume observed within leading stablecoins during the same period. The divergence indicates a potential shift in behavior among threat actors: as enforcement pressure and monitoring capabilities have intensified around stablecoins, some may be turning to alternative digital assets to evade sanctions. At the same time, within the stablecoin ecosystem, extortion/blackmail activity saw the highest relative growth between January and July 2025, increasing by 380% year over year.
With legislation progressing in multiple markets, TRM anticipates that stablecoins are likely to play an even greater part in the crypto landscape in the year ahead.
{{premium-content_chapter-divider}}
<span class="premium-content_chapter">CONCLUSION</span>
A multifaceted adoption landscape, with stablecoins at the center
This year’s report reinforces that crypto adoption is not driven by a single factor, but rather reflects a diverse and evolving set of incentives shaped by local economic conditions, user behavior, and regulatory environments.
In some jurisdictions, adoption has accelerated in response to regulatory clarity and institutional access; in others, it has expanded despite formal restrictions or outright bans. These contrasting dynamics point to a consistent trajectory: crypto is moving further into the financial mainstream. A key trend underscoring this shift is the rise of stablecoins.
As regulatory frameworks around stablecoins — and digital assets more broadly — continue to evolve, TRM’s upcoming policy report will explore the key developments shaping crypto policy and regulation heading into 2026.
{{premium-content_chapter-divider}}
About TRM Labs
TRM Labs provides blockchain analytics solutions to help law enforcement and national security agencies, financial institutions, and cryptocurrency businesses detect, investigate, and disrupt crypto-related fraud and financial crime. TRM’s blockchain intelligence platform includes solutions to trace the source and destination of funds, identify illicit activity, build cases, and construct an operating picture of threats. TRM is trusted by leading agencies and businesses worldwide who rely on TRM to enable a safer, more secure crypto ecosystem. TRM is based in San Francisco, CA, and is hiring across engineering, product, sales, and data science. To learn more, visit www.trmlabs.com.


