Q1 2026 Global Crypto Adoption Index

Key takeaways
- Global retail crypto activity reached USD 979 billion in Q1 2026, down 11% from Q1 2025, and continuing a two-quarter contraction driven by macroeconomic tightening and reduced retail participation.
- The United States retained the top spot at USD 212 billion, followed by South Korea (USD 69 billion), Russia (USD 48 billion), India (USD 46 billion), and Turkey (USD 40 billion).
- India was the most resilient major market, declining just 6% year-over-year against a 20% global average — sustained by P2P activity and domestic exchange growth.
- Turkey rose to #5, up from #7, growing 7% year-over-year — one of the few major markets to expand amid the global contraction.
- Venezuela ranked #17 globally at USD 17.9 billion, with adoption driven primarily by stablecoin usage rather than speculative trading. Stablecoins represent a large share of activity — including approximately 90% of the currently open Binance P2P order book volume — underscoring their role as the primary retail settlement mechanism.
- EUR-denominated stablecoins grew 12× in volume from January 2025 to March 2026, reaching USD 777 million per month — still under 0.3% of total VASP volume but accelerating, likely reflecting early diversification from dollar-denominated rails under sustained US trade policy uncertainty.
- The report examines three themes in depth: Iran's crypto market contraction under sustained sanctions enforcement, Venezuela's stablecoin-driven adoption under economic stress, and the growth of EUR-denominated stablecoins as early diversification from USD-based crypto rails.
{{horizontal-line}}
Introduction
TRM tracks global crypto adoption each quarter, and annually, to understand where retail activity is growing, how it shifts across jurisdictions, and how macroeconomic conditions shape participation. In Q1 2026, that activity slowed for the second consecutive quarter, marking the steepest back-to-back decline since the 2022 bear market.
Total attributed volume fell to USD 979 billion, down 11% from USD 1.1 trillion in Q1 2025. This follows a 23% decline in Q4 2025, signaling a sustained pullback in retail participation.
The downturn appears largely macro-driven. Q1 2026 coincided with a global risk-off environment shaped by uncertainty around US tariff policy, a strengthening dollar, and elevated real yields — conditions that have historically dampened retail crypto activity with a short lag. Bitcoin declined 22% over the quarter, ending near USD 68,000.
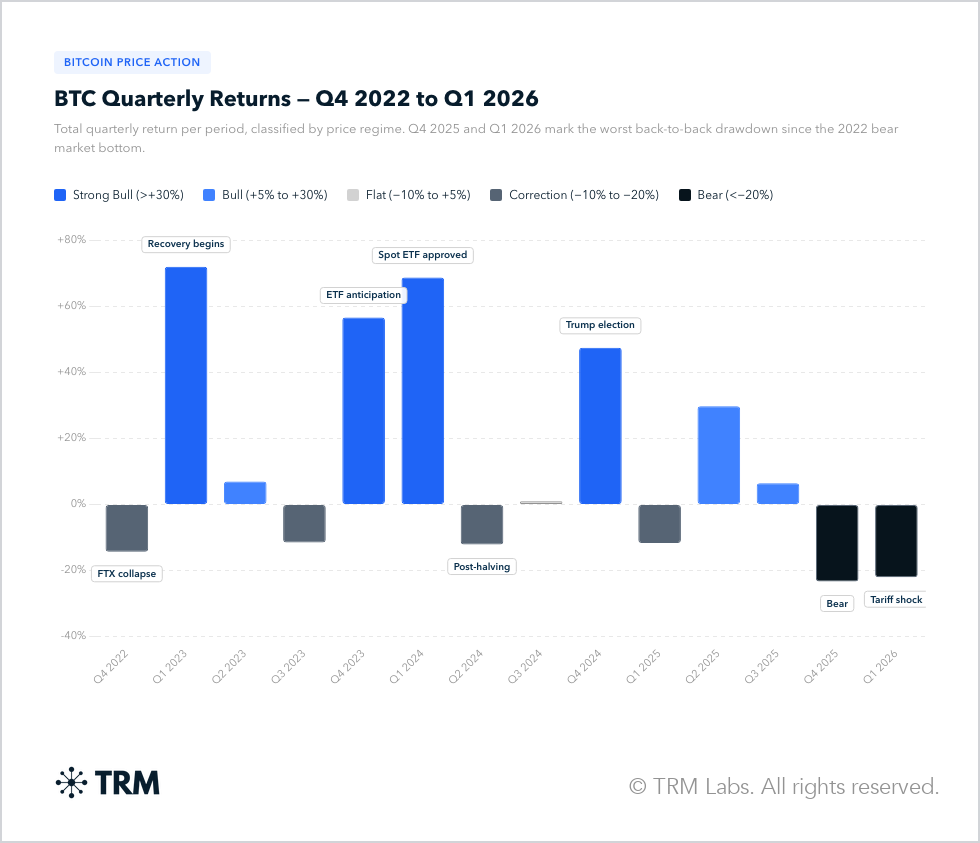
This pattern is consistent with how crypto has behaved across recent market cycles. Bitcoin returns have increasingly aligned with broader macro regimes, with strong performance during periods of liquidity expansion and sharp drawdowns during risk-off episodes such as the 2022 tightening cycle and the current tariff-driven shock. The back-to-back declines in Q4 2025 and Q1 2026 fit this pattern, reinforcing that retail crypto activity is closely tied to macro conditions rather than purely crypto-native dynamics.
What follows is a country-level breakdown of global crypto activity, showing how adoption is evolving across jurisdictions under macroeconomic pressure.
The index: Q1 2026 country rankings
The TRM Global Crypto Adoption Index below covers more than 200 jurisdictions across Q1 2026. Each country's attributed volume is derived by applying SimilarWeb web traffic shares to on-chain VASP transaction data, with a retail-only filter applied to remove institutional flows. The full methodology is described in the appendix.
Top 10 countries by Q1 2026 retail volume, with year-over-year comparison:
Figure 1: Top 10 countries by retail crypto volume, Q1 2026 vs Q1 2025 (USD billion). Source: TRM Labs, SimilarWeb.
The Q1 2026 rankings suggest continuity on the surface, meaningful shifts are occurring at the country level. The United States retained its dominant position at USD 212 billion transaction volume — nearly three times the next largest market — though its 11% year-over-year decline mirrors the broader global contraction. South Korea remained second at USD 69 billion despite a steep 28% drop, reflecting the outsized role of domestic retail speculation in a market sensitive to global risk sentiment. Russia held third at USD 48 billion, sustained in part by Grinex volumes filling the void left by Garantex enforcement. The most notable mover in the top 10 was Turkey, which rose from #7 to #5, growing 7% year-over-year to USD 40 billion — the only major market to expand in Q1 2026.
The volume decline does not tell a uniform story. Crypto adoption increasingly follows the fault lines of the broader global monetary system: developed markets with stable fiat and competitive domestic capital markets — the United States (−11%), South Korea (−28%), the United Kingdom (−17%), Germany (−25%) — saw the sharpest contractions as rising opportunity costs and risk-off sentiment reduced speculative appetite. Emerging markets behaved differently. India declined just 6% year-over-year, Turkey grew 7%, and Latin American and South Asian volumes held firm on a purchasing-power-adjusted basis. This divergence reflects a fundamental difference in demand: where domestic monetary policy is constrained or capital controls limit alternatives, crypto functions as a store of value and shadow dollar system — driven by need, not speculation, and therefore less sensitive to the global liquidity cycle.
Notable movers outside the top 10 include Singapore, which dropped from #17 to #29, and the UK, which fell from #4 to #7 after applying the retail-only filter. These shifts highlight the extent to which crypto activity in major financial hubs is driven by institutional flows, which are excluded from this analysis, rather than by underlying retail adoption.
Theme 1: Venezuela — stablecoins as a core retail payment rail
Venezuela's crypto activity in Q1 2026 occurred against a backdrop of significant political and enforcement developments. In January 2026, US authorities escalated pressure on the Maduro regime through a superseding indictment and a military operation that resulted in Maduro's capture and removal from power, intensifying uncertainty around the country's political and economic outlook.
This period also renewed attention on Venezuela's use of cryptocurrency within a sanctions-constrained economy. Prior TRM research and external reporting have documented how crypto has been used alongside traditional financial channels, both at the retail level and in state-linked activity, including efforts to facilitate oil transactions and move value outside the formal financial system.
Against this backdrop, Venezuela ranked #17 globally in Q1 2026 with USD 17.9 billion in attributed retail volume — up from #22 in Q1 2025 — indicating sustained demand relative to other markets despite global contraction.
Stablecoins dominate Venezuelan crypto activity. Below we show Binance's P2P order book, which shows live listings in which individual traders post advertisements to either buy or sell a crypto asset in exchange for VES fiat. The order book shows 2,565 active VES listings as of April 2026, of which 90.2% are denominated in USDT.
Table 1: Active Binance P2P listings for VES fiat pairs by crypto asset, April 2026. Source: Binance P2P.
Stablecoins — particularly USDT — account for a large share of transaction activity in Venezuela, consistent with prior TRM research showing that retail usage in high-inflation and capital-constrained environments is dominated by dollar-denominated assets.
Three structural factors drive this pattern:
- Currency instability: Persistent bolívar depreciation has driven demand for dollar-denominated stores of value.
- Capital controls and restricted banking access: Limited access to foreign currency and international payment systems increases reliance on crypto rails.
- Established parallel markets: Longstanding use of informal exchange channels makes stablecoins a natural extension of existing financial behavior.
Venezuelan crypto activity is driven by domestic economic and political conditions — not market cycles — with stablecoins serving as the primary transactional and savings tool.
Theme 2: EUR-denominated stablecoins gaining ground
USD-denominated stablecoins dominate on-chain retail settlement. In January 2025, USD stablecoins processed at retail VASPs totaled USD 310 billion; by March 2026 that figure stood at USD 274 billion — a decline reflecting broader market contraction. EUR-denominated stablecoins tell a different story: from USD 69 million in January 2025 to USD 777 million in March 2026 — 12-fold growth in 15 months.

The growth is concentrated in a small number of assets — euro_coin, EURS, EURC, and EURt — most with European issuer backing and regulatory alignment under MiCA. At under 0.3% of total VASP volume, EUR stablecoins remain a niche instrument, but the trajectory suggests MiCA-driven regulatory clarity is beginning to attract institutional and retail adoption in European markets.

Three factors drive this growth:
- Regulatory clarity under MiCA: The introduction of the EU's Markets in Crypto-Assets (MiCA) framework has provided clearer rules for issuance and compliance, reducing uncertainty for both issuers and users and enabling more formal integration with regulated platforms.
- Demand for non-USD settlement rails: Ongoing macro uncertainty and US-centric financial conditions may be prompting early diversification toward alternative fiat-denominated rails, particularly within Europe.
- Institutional and on/off-ramp integration: European exchanges and payment providers are increasingly supporting EUR-denominated products, making it easier for users to enter and exit crypto markets without converting into USD.
Theme 3: Iran — crypto under sanctions and the Strait of Hormuz toll system
Iran's crypto activity in Q1 2026 unfolded against a backdrop of heightened geopolitical tension and escalating sanctions enforcement targeting the country's financial infrastructure.
In January 2026, the US Treasury took the unprecedented step of sanctioning two crypto exchanges — Zedcex and Zedxion — for facilitating transactions tied to the Islamic Revolutionary Guard Corps (IRGC), marking the first time digital asset platforms were designated for operating in Iran's financial sector. This action reflects a broader shift toward targeting the service-layer infrastructure that enables sanctions evasion.

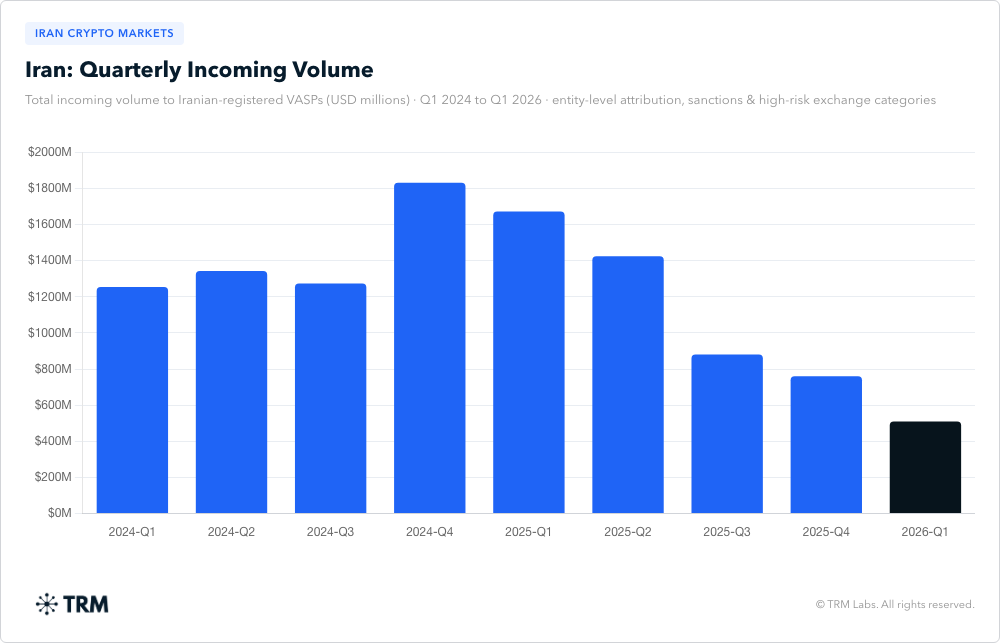
Iranian-attributed crypto volumes declined 59% from Q1 2024 levels, alongside a broader global contraction in crypto markets. However, the sharper decline in Iran likely reflects the additional impact of wartime conditions and internet outages, which have constrained access and suppressed transaction activity. Iran's crypto ecosystem saw volumes compress through Q1 2026, with monthly inflows to Iranian exchanges falling from a peak of USD 2.1 billion in Q4 2024 to USD 510 million in Q1 2026 — the lowest levels in the past year.
At the retail level, crypto usage in Iran continues to be driven by access to dollar-denominated stablecoins. With the rial heavily devalued and limited access to the international financial system, USDT functions as a de facto savings and payments instrument. Transfer activity is predominantly small in size, with most transactions under USD 1,000, consistent with retail-driven usage.
At the same time, Q1 2026 highlights the growing role of crypto in state-linked activity. In mid-March, the IRGC began charging ship operators up to USD 2 million per vessel to transit the Strait of Hormuz. This reflects a broader pattern in which crypto is used not only as a retail workaround to sanctions constraints, but also as part of state-linked financial activity where traditional channels are restricted.
Taken together, the data suggests that while crypto remains embedded in Iran's economy, enforcement actions targeting exchange infrastructure and major geopolitical events are having a measurable impact on overall volumes, even as both retail and state-linked use cases persist.
Conclusion
The Q1 2026 Global Crypto Adoption Index shows a market increasingly shaped by macroeconomic and geopolitical forces rather than purely crypto-native cycles.
Activity is diverging across jurisdictions. In developed markets, volumes have declined alongside tighter financial conditions, while in emerging and high-risk environments, demand remains more resilient — driven by the need for alternative financial infrastructure.
The thematic findings reflect this shift. Enforcement is constraining activity in Iran, while in Venezuela, crypto continues to function as a retail financial tool under economic stress. At the same time, the growth of EUR-denominated stablecoins highlights how regulatory clarity is beginning to influence adoption in more formal financial systems.
Taken together, crypto adoption is becoming increasingly regionalized, with usage patterns tied closely to local economic conditions, regulation, and geopolitical risk.
Methodology
Volume data is sourced from TRM's gold entity asset metric daily table, which aggregates on-chain incoming volume by entity, asset, and date. Country attribution uses SimilarWeb monthly web traffic shares by entity and country, applied as a multiplier to each entity's monthly volume. Only curated assets are included.
Retail filter: analysis is limited to entities in the Exchange, Payment Services, Non-Custodial Exchange, Hosted Wallet, P2P Crypto Marketplace, Lending Service, and Unhosted Wallet categories. Investment Services, OTC Desks, Custody, Financial Services, and Mining are excluded — removing approximately USD 267 billion in Q1 2026 volume that would otherwise double-count institutional flows.
SimilarWeb proxy: March 2026 shares are used for all Q1 2026 months. January and February 2026 SimilarWeb data remain pipeline gaps; March 2026 data is now live. Q1 2025 baseline uses an average of October–November 2025 SimilarWeb shares. Iran is excluded from country attribution due to near-zero SimilarWeb coverage reflecting widespread VPN usage. Approximately 432 of ~600 VASP entities in TRM's coverage universe have SimilarWeb data; volume from the remaining entities is excluded from country-level totals.
{{horizontal-line}}
Frequently asked questions (FAQs)
1. How does TRM measure crypto adoption by country?
TRM applies SimilarWeb monthly web traffic shares to on-chain VASP transaction data, distributing each exchange's volume across countries proportionally by their share of site visits. Only retail-oriented entities — including exchanges, P2P platforms, and hosted wallets — are included, removing approximately USD 267 billion in institutional flows from the Q1 2026 total. This methodology produces country-level attributed volume estimates across more than 200 jurisdictions.
2. Why did global retail crypto volume decline in Q1 2026?
Global retail crypto activity fell 11% year-over-year to USD 979 billion, the second consecutive quarter of contraction. The decline appears macro-driven: Q1 2026 coincided with a risk-off environment shaped by US tariff uncertainty, a strengthening dollar, and elevated real yields — conditions that have historically suppressed retail crypto participation. Bitcoin declined 22% over the quarter, reinforcing the connection between macro conditions and retail activity levels.
3. What drove Turkey's growth while other major markets contracted?
Turkey rose from #7 to #5, growing 7% year-over-year to USD 40 billion — the only major market to expand in Q1 2026. The growth reflects Turkey's structural demand for dollar-denominated crypto assets amid persistent lira depreciation and limited access to alternative savings instruments. Markets with constrained domestic monetary environments have shown greater resilience across multiple market cycles, as demand is driven by economic necessity rather than speculative appetite.
4. Why was India more resilient than other major markets?
India declined just 6% year-over-year against a 20% global average, sustained by P2P activity and continued domestic exchange growth. This resilience reflects a pattern seen across emerging markets where crypto serves as a savings and payments tool rather than a purely speculative instrument — making volumes less sensitive to global risk-off cycles. India's continued adoption of domestic crypto platforms has also provided a structural floor for activity.
5. How is crypto usage in Iran changing under sanctions?
Iranian-attributed crypto volumes declined 59% from Q1 2024 levels, compressed by wartime conditions, internet outages, and sustained enforcement targeting exchange infrastructure. Monthly inflows to Iranian exchanges fell from a peak of USD 1.8 billion in Q4 2024 to USD 510 million in Q1 2026. At the retail level, USDT continues to function as a de facto savings and payments instrument, with most transactions under USD 1,000. Q1 2026 also highlighted growing state-linked use cases, including cryptocurrency collection tied to IRGC-linked transit fees at the Strait of Hormuz.
6. What is driving the growth of EUR-denominated stablecoins?
EUR-denominated stablecoins grew 12-fold in 15 months, from USD 69 million per month in January 2025 to USD 777 million in March 2026. Three factors appear to be driving this: regulatory clarity under the EU's MiCA framework, growing demand for non-USD settlement rails amid US trade policy uncertainty, and increased integration of EUR-denominated products by European exchanges and payment providers. At under 0.3% of total VASP volume, EUR stablecoins remain a niche instrument, but the trajectory suggests adoption is accelerating.
7. Why do stablecoins dominate crypto activity in Venezuela?
Venezuela ranked #17 globally in Q1 2026 with USD 18.3 billion in attributed retail volume, with USDT accounting for approximately 90% of active Binance P2P listings for Venezuelan fiat pairs. Three structural factors drive this: persistent bolívar depreciation creating demand for dollar-denominated stores of value, capital controls and restricted banking access limiting alternatives, and established informal exchange infrastructure that makes stablecoins a natural extension of existing financial behavior. Venezuela's crypto activity is driven by domestic economic conditions rather than global market cycles.
8. What should compliance teams take away from this report?
Compliance teams should focus on three dynamics emerging from Q1 2026 data. First, sustained enforcement is measurably compressing volumes in sanctioned jurisdictions like Iran, even as both retail and state-linked use cases persist. Second, emerging markets with constrained monetary systems — Turkey, India, Venezuela — show sustained adoption patterns less sensitive to global risk cycles, warranting continued attention as volume concentrates there. Third, the rapid growth of EUR-denominated stablecoins under MiCA signals a potential shift in the geography of stablecoin compliance risk that teams should begin monitoring.