2026 Crypto Crime Report
TRM identifies record USD 158 billion in illicit crypto flows in 2025, reversing a multi-year decline
Key takeaways
- Illicit crypto volume reached an all-time high of USD 158 billion in 2025, up nearly 145% from 2024.
- Despite the increase in absolute illicit volume, illicit volume as a proportion of overall crypto volume fell in 2025, from 1.3% in 2024 to 1.2% in 2025.
- While illicit activity represented a small share of overall on-chain volume, illicit entities captured 2.7% of available crypto liquidity in 2025, according to a new metric released by TRM that frames risk relative to deployable capital rather than raw transaction volume.
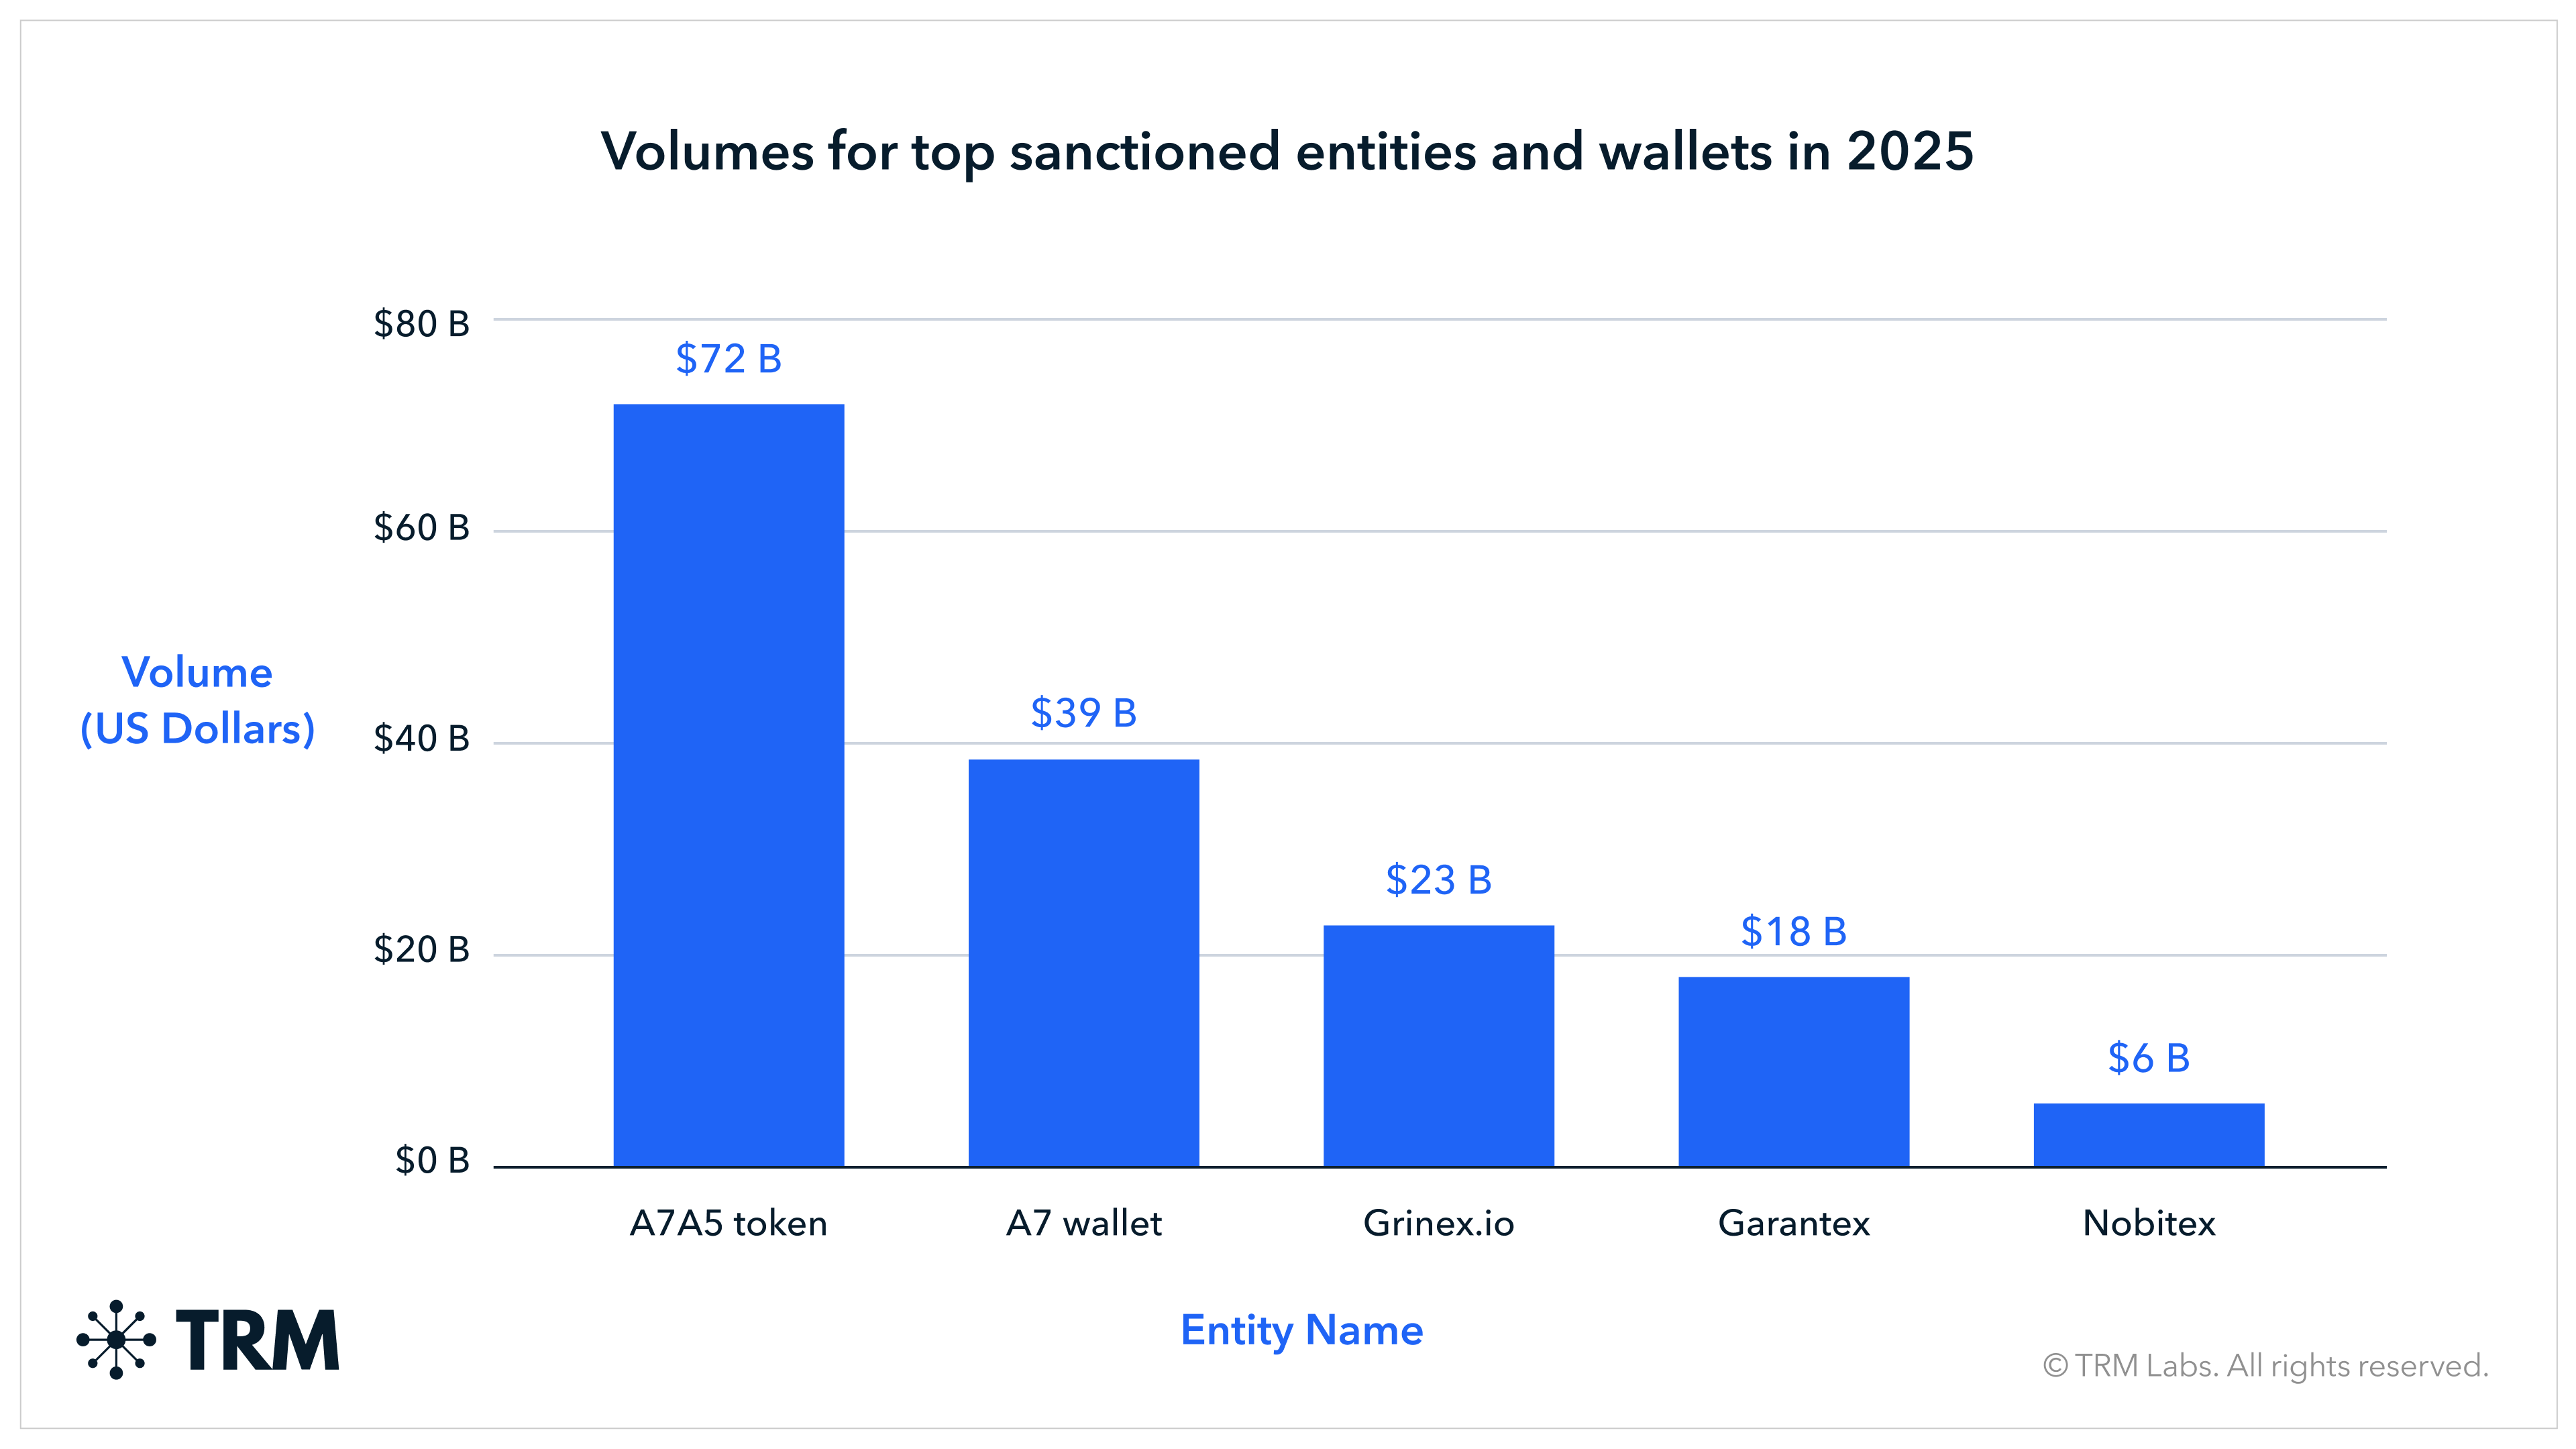
- Sanctions-related activity in 2025 was overwhelmingly driven by Russia-linked flows, largely due to the rapid growth of the ruble-pegged stablecoin A7A5, which processed more than USD 72 billion in total volume.
- The wallet cluster associated with the Russian sanctions evasion network A7 is linked to at least USD 39 billion in 2025 — reflecting concentrated, coordinated activity closely associated with sanctions evasion and state-aligned financial infrastructure, rather than broad market usage.
- In 2025, illicit actors stole USD 2.87 billion across nearly 150 hacks — fewer incidents than last year — but the Bybit breach alone drove USD 1.46 billion (51%), accounting for much of the year-over-year increase in total losses.
- Major geopolitical players leaned further into cryptocurrency in 2025, using crypto rails as durable financial infrastructure. Iran and Venezuela relied on crypto for sanctions-constrained payments and financial services at scale. Chinese language escrow and money laundering networks processed over USD 100 billion, operating as critical infrastructure for global illicit markets, rather than as state-directed activity.
These takeaways reflect the current state of the cryptocurrency environment: no longer novel or peripheral, but broadly integrated and, in some cases, deeply embedded in traditional economic activity. Regulators, everyday users, governments, and criminal actors alike now encounter crypto as a routine part of financial life. Crypto tools are easier to use, increasingly seamless, and woven into both legitimate and illicit financial services, while many governments are incorporating digital assets into national economic strategies. The result is a growing baseline fluency with crypto that has, at the same time, improved the detection of illicit activity and enabled larger volumes of value to move through the broader illicit crypto ecosystem.
The percentage of illicit activity represents only a small fraction of overall activity, as has always been the case. However, TRM believes there are better ways to contextualize this figure and has adopted methodological changes to reflect this, detailed below.
Revisiting our methodology: Considering illicit total volumes and illicit activity relative to incoming liquidity
Illicit cryptocurrency wallets received an estimated USD 158 billion in incoming value in 2025, a sharp increase from USD 64.5 billion in 2024 and the highest level observed over the past five years. Prior to this rebound, total incoming value to illicit entities had declined steadily from USD 85.9 billion in 2021 to USD 75.4 billion in 2022 and USD 73.3 billion in 2023, before reaching a low point in 2024.
The change in 2025 reflects a combination of intensified sanctions designations, increased use of crypto by nation-state actors, and technological advances by TRM that enable detection of previously unattributed illicit volume. The Beacon Network is one such example: a real-time intelligence-sharing system that allows law enforcement agents to flag addresses linked to financial crime, immediately alerting exchanges and triggering risk-based responses.

Despite the increase in absolute value in 2025, the percentage share of illicit activity continued to decline. Measured as a share of total attributed on-chain volume, illicit activity fell slightly to 1.2% in 2025 from 1.3% in 20241, well below the 2023 high of 2.4%.
When we contextualize illicit activity relative to incoming liquidity, a similar trend emerges: illicit entities received 2.7% of incoming VASP flows in 2025, compared with 2.9% in 2024 and 6.0% in 2023. Together, these metrics indicate that while certain illicit categories expanded in absolute terms, illicit actors absorbed a smaller proportion of new capital entering the crypto ecosystem.

{{28-2026-crypto-crime-report-footnote-1}}
Russia-linked sanctions designations and improved attribution drove the largest shift in illicit crypto activity
Volumes associated with sanctioned entities and jurisdictions rose sharply in 2025, led by USD 72 billion received by the A7A5 token, followed by an additional USD 39 billion associated with the A7 wallet cluster. This growth was highly concentrated: the vast majority of sanctions-linked volume was connected to Russia-linked entities, including Garantex, Grinex, and A7.
The increase is not linked to growth in sanctions evasion activity alone, but also to new designations of large entities in combination with improved attribution of cryptocurrency addresses to already-sanctioned actors.
{{28-2026-crypto-crime-report-callout-1}}
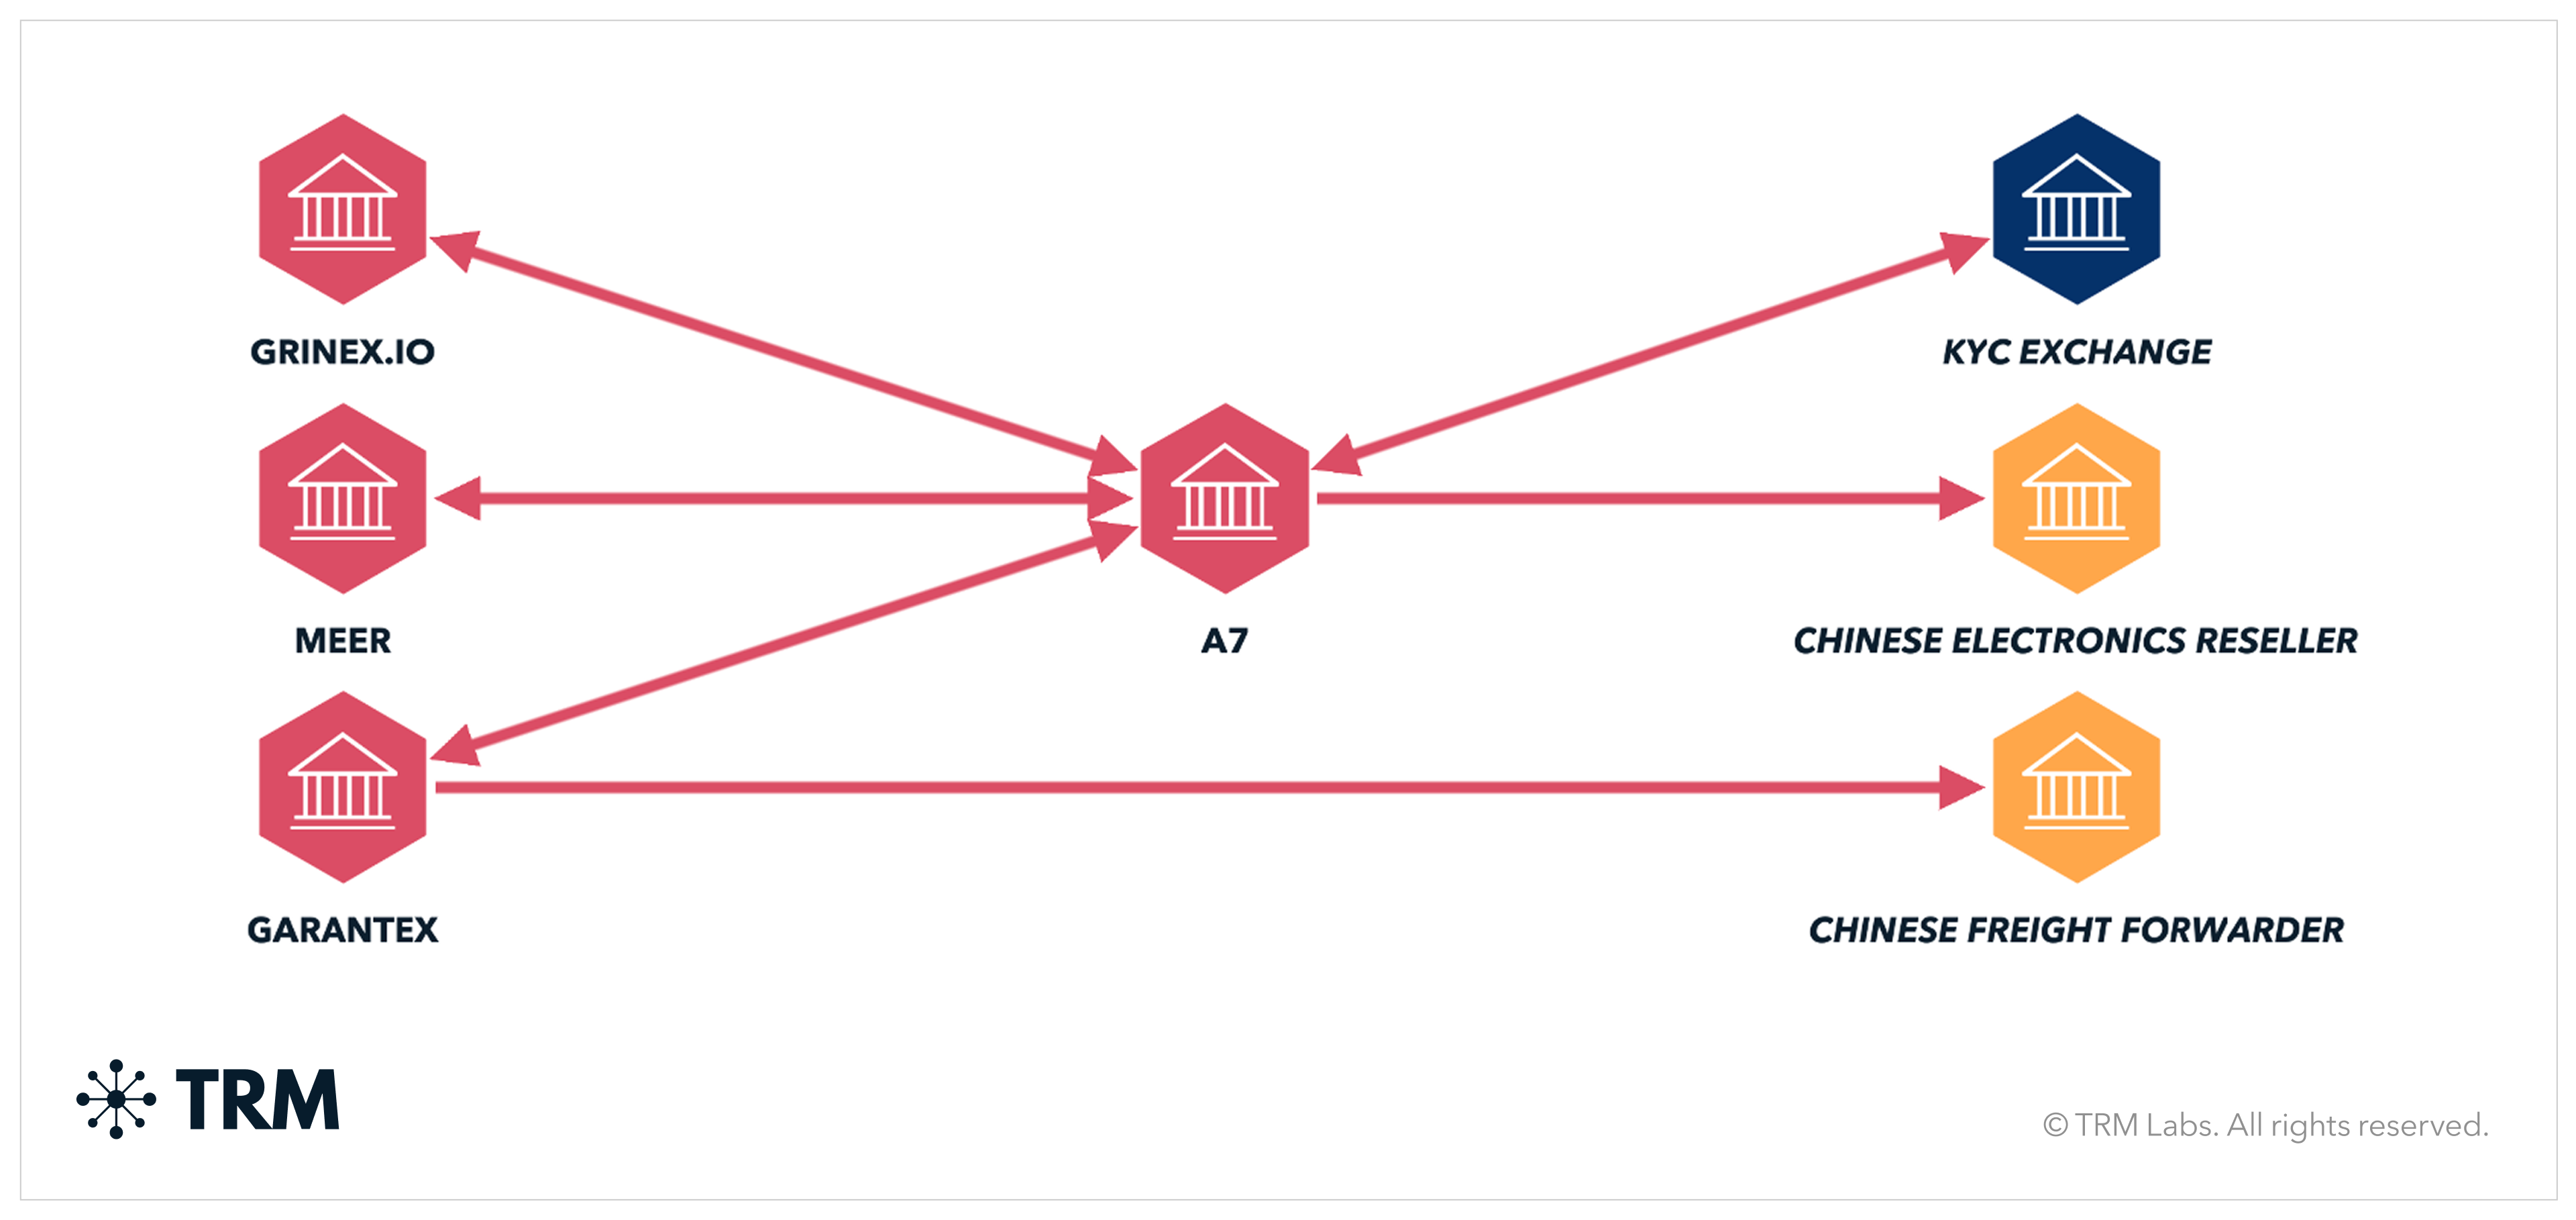
A7 stands out not only for its scale, but for its role as centrally coordinated sanctions evasion architecture tied to Russian state interests. On-chain activity indicates that A7 functions as a hub connecting Russia-linked actors with counterparties across China, Southeast Asia, and Iran-linked networks — reflecting a deliberate shift toward crypto-enabled, state-aligned financial infrastructure.
While the A7 wallet cluster is closely associated with sanctions evasion activity, the A7A5 token reflects a broader strategy to reduce reliance on USD-backed rails by expanding use of a ruble-pegged stablecoin. As a result, high volumes associated with A7A5 do not exclusively represent sanctions evasion, but rather sanctioned activity more broadly, including state-aligned economic flows. Together, these dynamics illustrate how Russia-linked actors are increasingly leveraging crypto — particularly stablecoins and higher-risk services — as part of a long-term, nationstate-backed strategy.
Inflows to sanctioned entities predominantly used stablecoins. This preference for stablecoins and move to high-risk services reflects the environment of more effective enforcement, expanded use of crypto identifiers in sanctions designations, and increased risk of detection or asset freezing. Together, these dynamics point to a sanctions environment in which authorities prioritize Russia-linked networks; enforcement tools are more crypto-native; and illicit actors adapt by moving to riskier, less regulated channels.
Geopolitics moved on-chain
Geopolitical pressures reshaped illicit crypto activity in 2025, as state and state-aligned actors moved to using cryptocurrency as core financial infrastructure rather than a tool of last resort. While Russia-linked networks largely drove sanctions-related crypto volume, the more consequential shift was the institutionalization of crypto rails by other sanctioned actors.
In Venezuela, for example, crypto functioned as a pressure-release valve in a heavily sanctioned economy where traditional banking access is limited — supporting payments, remittances, and state-linked financial activity.
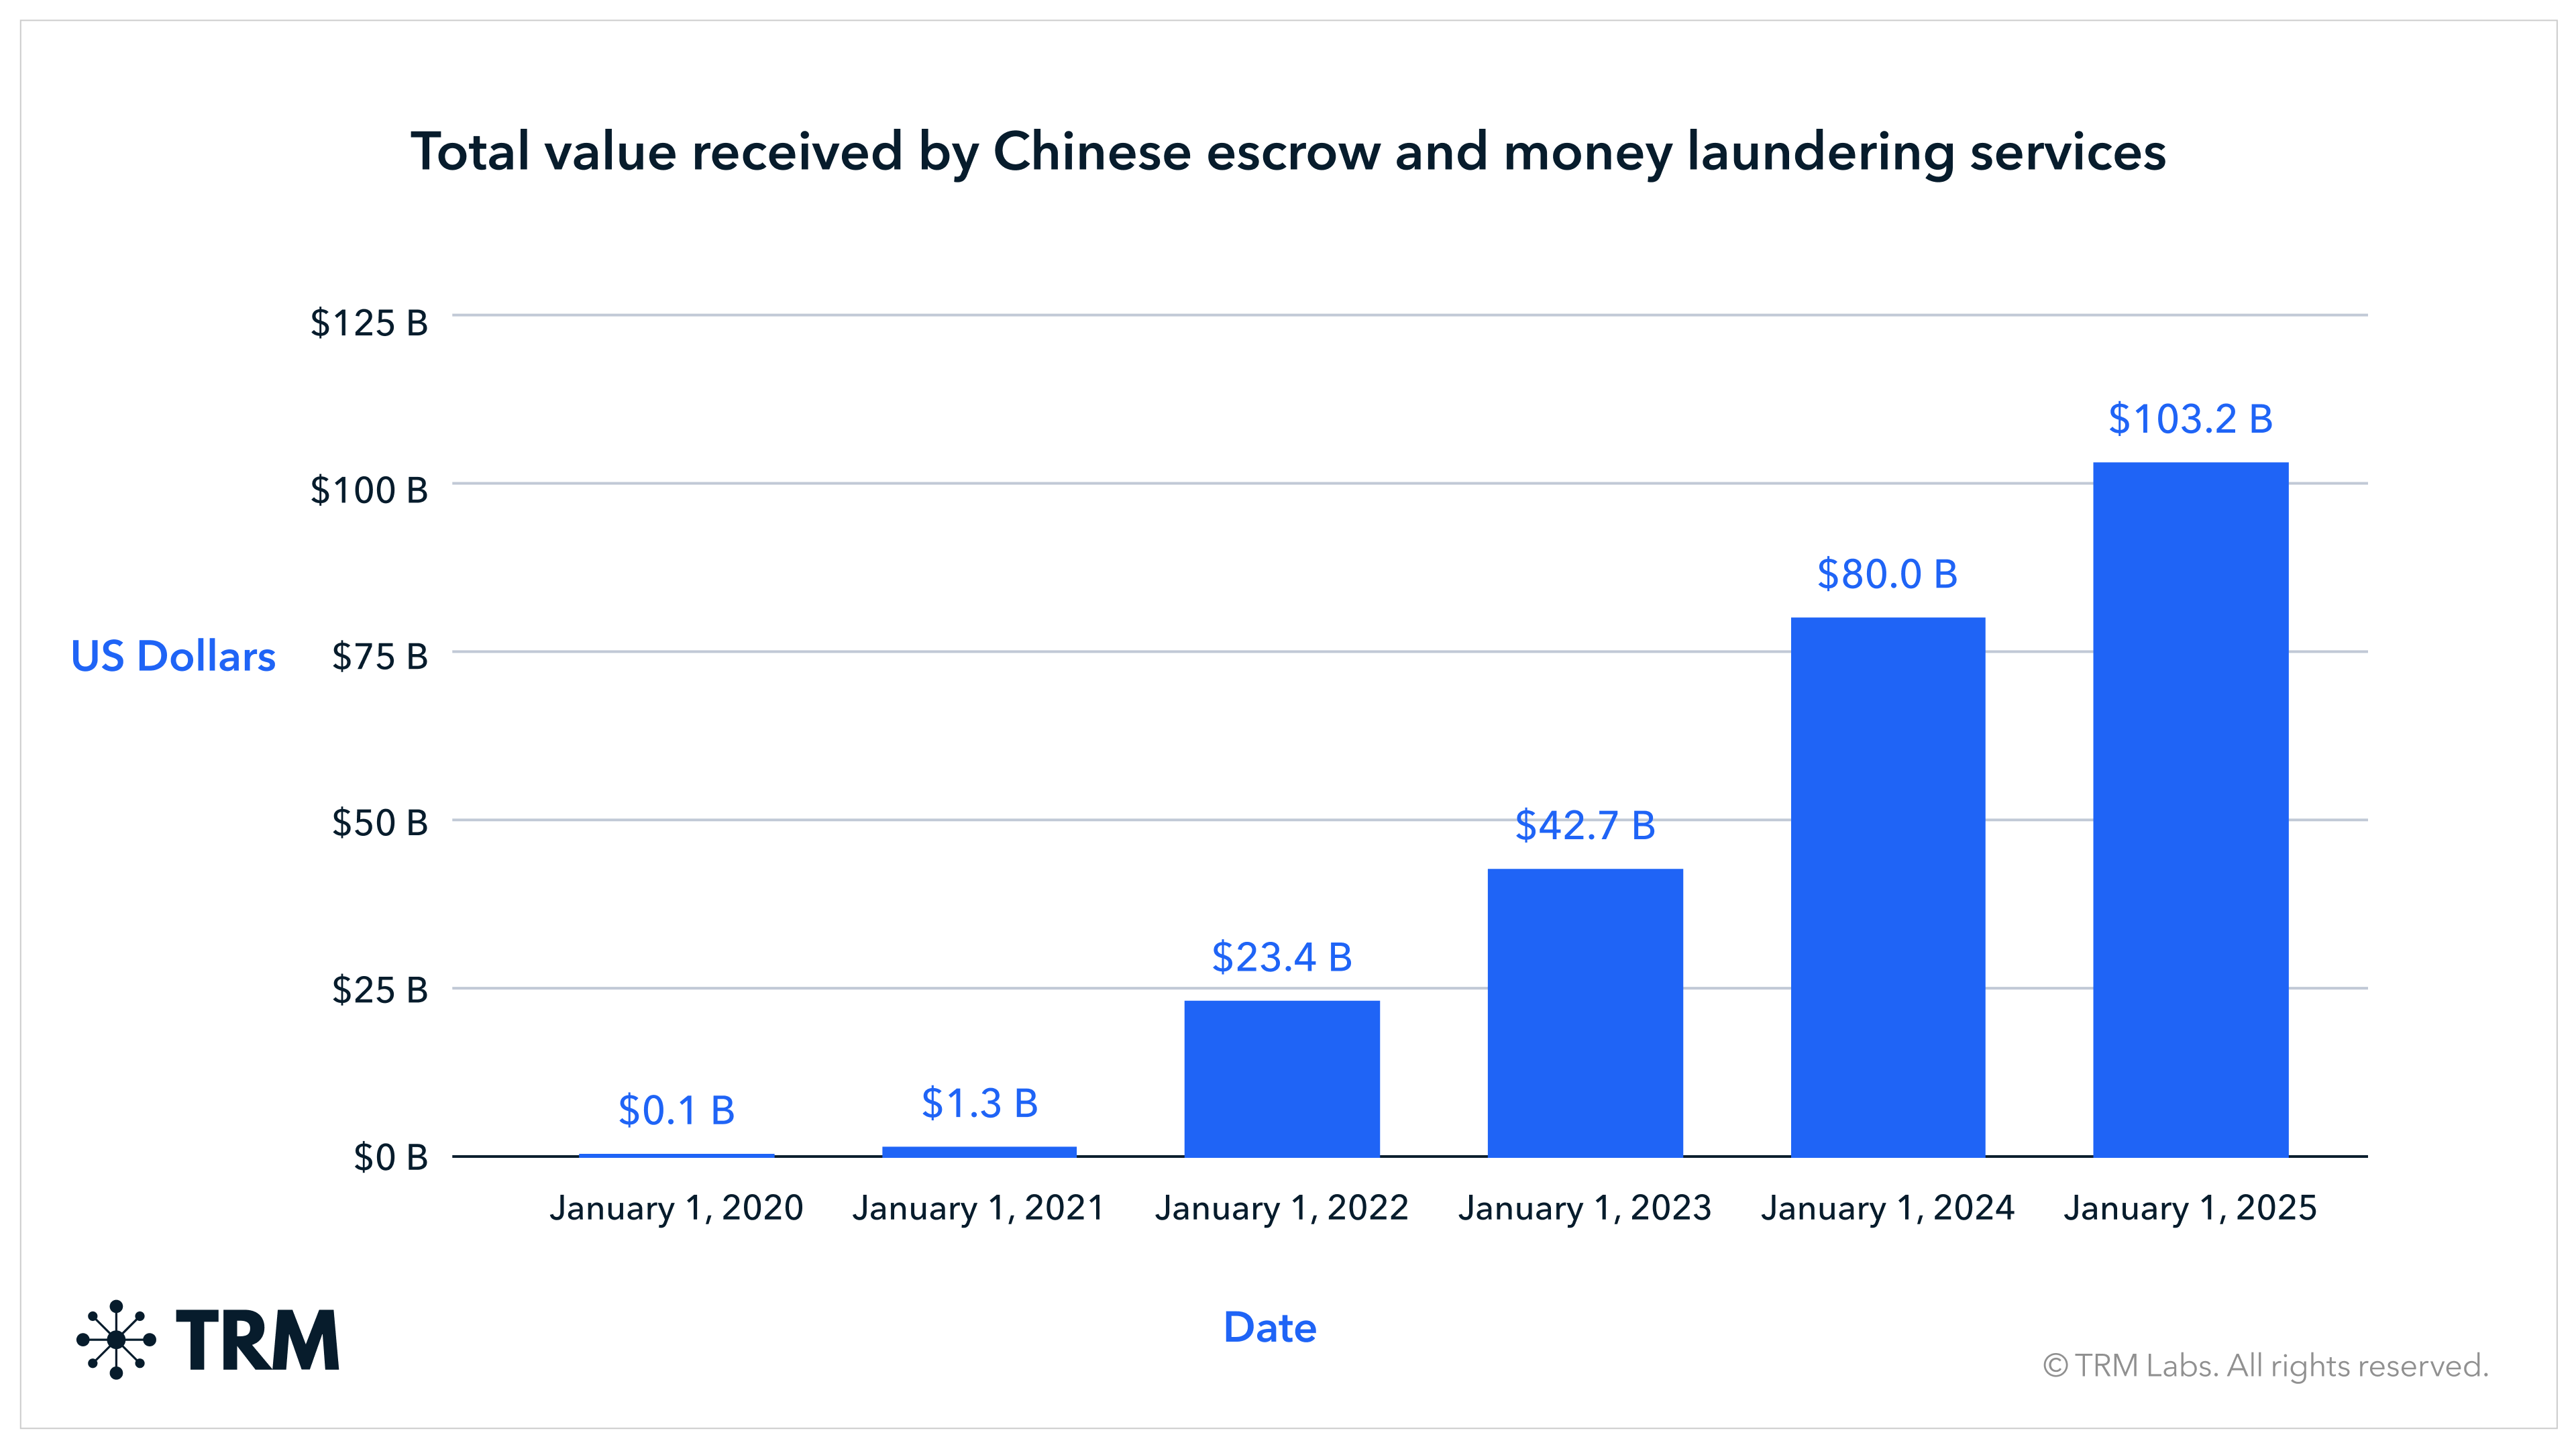
China occupies a distinct role in the illicit crypto landscape as a hub for illicit financial services infrastructure. TRM analysis shows that activity associated with Chinese-language escrow services and underground banking networks has grown sharply over time, with adjusted crypto volume rising from approximately USD 123 million in 2020 to over USD 103 billion in 2025.
This sustained growth reflects the increasing reliance of a wide range of illicit actors — including scam networks, cybercrime groups, and sanctions evasion intermediaries — on escrow-based crypto services for settlement and cash-out across the APAC region.
These services facilitate high-volume stablecoin transactions and bridge crypto assets into the formal financial system through OTC brokers, money mule networks, and APAC-based casinos.
This activity reiterates a clear theme for 2025: the illicit crypto ecosystem is being shaped by its accessibility and integration into everyday financial activity. Globally accessible service providers like these Chinese escrow services enable criminal demand at scale, with stablecoins serving as the primary connective layer between geopolitical actors, intermediaries, and illicit markets.
Crypto crime numbers reached an all-time high
Adjusted total incoming illicit cryptocurrency activity rose to approximately USD 158 billion in 2025, the highest level observed in the past five years, and a sharp increase from USD 64 billion in 2024. This reversal followed three consecutive years of decline and reflects a renewed expansion of illicit activity across multiple categories, rather than growth driven by a single event type or market cycle.
Key drivers of this increase include:
- Expanded sanctions-related activity, which grew over 400% year-over-year, alongside continued increases among blocklisted entities (32%) and hacked or stolen funds (31%) — reflecting both large-scale enforcement actions and improved attribution of activity linked to already-sanctioned actors.
- More modest growth in market-driven illicit activity, with darknet markets (20%) and illicit goods and services (12%) expanding at a slower pace.
- Improved speed and coordination of attribution through TRM’s Beacon Network, which enables earlier identification of illicit activity by connecting law enforcement partners and private sector institutions across jurisdictions. Beacon has not expanded what TRM defines as “illicit activity,” but has accelerated how quickly high-confidence intelligence, incident data, and investigative insights are incorporated into our platform — improving visibility into emerging threats and large-scale events as they unfold.
- Growth in blocklisted activity across multiple crime types, driven in part by expanded stablecoin issuer enforcement that targets wallets linked to sanctions evasion, terrorism financing, fraud, and hacking.
Taken together, these dynamics indicate that the 2025 increase in total incoming illicit crypto activity was driven less by broad-based expansion across all illicit activity types and more by concentrated shocks, enforcement-linked developments, and faster, higher confidence attribution by TRM, particularly around large-scale hacks and sanctions-related flows.
{{premium-content_chapter-divider}}
TRM’s methodology and approach
<h3 class="premium-content_subhead">Why we rethought how illicit crypto activity is contextualized</h3>
Illicit cryptocurrency activity has traditionally been expressed as a percentage of total blockchain transaction volume. While this framing offers a convenient high-level reference point, it has meaningful limitations that become more pronounced as crypto markets mature.
Total blockchain volume captures a wide range of activity that does not necessarily correspond to real economic transfers or changes in ownership. High-frequency trading, automated market making, arbitrage, internal exchange flows, and technical behaviors such as funds cycling repeatedly across addresses can materially inflate transaction volume without introducing new capital or increasing the amount of value effectively in circulation.
Although TRM applies techniques to estimate ownership changes and filter out certain internal or self-referential movements, these methods are inherently imperfect. In practice, distinguishing between genuine economic transfers and technical or intermediary-driven activity is increasingly difficult in markets defined by rapid trading, layered infrastructure, and repeated reuse of the same funds across multiple wallets. As a result, total blockchain volume often functions as a noisy denominator — one that can mask the true economic scale and impact of illicit activity rather than illuminate it.
For this reason, TRM has made two changes to this estimate this year:
- Lower-bound estimate: Refining the denominator
- Illicit activity as a share of VASP outflows
1. Lower-bound estimate: Refining the denominator
For the lower-bound estimate, TRM now constrains the denominator to cryptocurrency activity involving known services, known wallets, and service-like clusters, along with a limited set of clusters that clearly behave like services but lack full attribution. This adjustment is designed to more closely align the denominator with activity that reflects real economic use, rather than technical or self-referential movement.
The revised approach intentionally excludes large volumes of activity that inflate transaction counts without representing meaningful transfers of value. This includes wash trading, peel chains, internal exchange movements, and high-frequency arbitrage activity. Such behaviors can generate substantial on-chain volume while introducing little to no new capital and without increasing the amount of value available to users. Their prevalence has grown alongside newer blockchains and trading environments that enable highly automated strategies.
By narrowing the denominator to activity that can be confidently identified and economically contextualized, this methodology produces a more conservative and analytically meaningful baseline for assessing illicit activity. The principal tradeoff is the exclusion of some peer-to-peer and personal wallet activity that does not interact with identifiable services. TRM views this tradeoff as justified, as we prioritize precision and interpretability over completeness in environments where raw transaction volume can obscure — rather than clarify — economic reality.
2. Illicit activity as a share of VASP outflows
TRM is introducing a new metric that frames illicit activity as a share of VASP outflows, rather than as a share of total on-chain transaction volume. This approach reflects our view that illicit risk is better understood relative to available liquidity than to aggregate blockchain activity. In this report, we approximate available liquidity using the USD value of funds leaving virtual asset service providers (VASPs). VASP outflows represent the point at which value exits custodial environments and becomes freely deployable across the on-chain ecosystem, where it can be transferred, converted, and used for a wide range of purposes — including illicit activity.
A simplified example illustrates the distinction.
{{28-2026-crypto-crime-report-callout-2}}
This liquidity-based framing better aligns with how illicit networks operate in practice. Illicit actors are constrained not by transaction counts, but by access to transferable value that can fund operations, payments, and downstream networks. By anchoring the denominator to funds leaving VASPs, this metric focuses on the pool of capital that is realistically accessible for use, rather than on technical transaction activity driven by market structure, trading strategies, or internal system behavior.
We do not suggest that VASP outflows capture all sources of liquidity, nor that every outflow represents newly introduced capital. However, as a consistent and observable baseline, available liquidity provides a more stable and economically meaningful context for assessing illicit activity than total blockchain volume alone. Used alongside traditional measures, this approach offers a clearer and more intuitive view of how illicit actors participate in — and draw value from — the crypto ecosystem.
How we calculated total illicit volumes
TRM’s estimate of total illicit cryptocurrency volume is based on the USD value of funds stolen through crypto-native hacks, combined with the USD value of transfers to blockchain addresses on Bitcoin, Ethereum, TRON, Binance Smart Chain, and Polygon that TRM has attributed to illicit entities. These entities include a broad range of threat categories, such as fraud schemes, sanctioned actors, terrorist organizations, and darknet marketplaces.
We treat this estimate as a conservative baseline — a minimum, or “floor,” for illicit cryptocurrency activity. Illicit activity on blockchains is frequently identified with delay, as attribution improves over time through law enforcement actions, sanctions designations, judicial proceedings, and open-source reporting. As new intelligence emerges and additional wallets are linked to known illicit actors, historical estimates often increase, reinforcing the view that initial measurements understate the true scale of illicit activity at the time it occurred.
Several categories of activity are intentionally excluded from this estimate.
- First, we exclude proceeds from crimes that originate in fiat currency and are later converted into cryptocurrency. These flows typically enter the crypto ecosystem through on-ramps and payment intermediaries and are difficult to identify using on-chain data alone. Accurately estimating this activity would require supplementary information from VASPs and national financial intelligence units that is not consistently available.
- Second, we exclude transfers to blockchain addresses that have not been attributed to illicit activity. While unattributed addresses may include illicit actors, they also encompass a large volume of legitimate activity. Where relevant, we estimate an upper bound for such activity by examining transactions involving unattributed addresses that do not appear to represent internal transfers within a single entity.
- Third, our estimate excludes the laundering of illicit crypto proceeds. The illicit volume metric is intended to capture the revenue generated by illicit actors, not the subsequent movement of those funds through laundering chains. When calculating illicit crypto volume as a share of overall blockchain activity, we focus on incoming transaction volume to attributed illicit entities and exclude transfers that appear to be internal to a single entity, such as peeling chains or certain decentralized exchange swaps.
Disclaimer: Overall illicit volume figures are likely to be revised upwards
These figures reflect TRM’s current estimates of illicit cryptocurrency volume based on the best available intelligence at the time of publication. However, detecting and attributing illicit activity is inherently complex and often occurs with delay. As investigations progress, new sanctions are issued, cases are unsealed, and additional information becomes public, previously unknown wallets and transactions are frequently linked to illicit actors.
As a result, overall estimates of illicit volume tend to increase over time. Readers should therefore view the figures in this report as a dynamic baseline rather than a fixed measurement. This expectation of future upward revision applies both to our current methodology and to prior estimates, reflecting the evolving nature of attribution and the continual incorporation of new intelligence.
{{premium-content_chapter-divider}}
Sanctions
<h3 class="premium-content_subhead">Inflows to sanctioned entities increased; counter-Russia sanctions remained an international priority</h3>
Cryptocurrency associated with inflows to sanctioned entities and jurisdictions reached USD 93 billion in 2025, with USD 72 billion of that associated with volumes with the A7A5 token. This increase, however, is largely due to new designations of large entities and to additional attribution of cryptocurrency addresses linked to already-designated entities.
While sanctions volume already accounts for the majority of illicit activity, this is compounded when considering entities under FinCEN special measures. 2025 saw the designation of Huione Group (a Cambodian conglomerate) as a foreign financial institution of primary money laundering concern under FinCEN, receiving over USD 39.6 billion in 2025 alone. New designations of major entities such as Russian cross-border payment platform A7, the Grinex rebrand of now-sanctioned Russian cryptocurrency exchange Garantex, and the network of Cambodia-based transnational criminal organization (TCO) Prince Group, drove a large share of volume to sanctioned entities and jurisdictions.
Authorities’ increasing comfort in the crypto space has enabled the attribution of cryptocurrency addresses to already-designated entities — such as the Islamic Revolutionary Guard Corps (IRGC), Herzallah Exchange and General Trading Company (Hamas), Ansarallah (Houthis), and North Korea’s Cheil Credit Bank — also contributed to this increase.
Nearly 95% of inflows to sanctioned entities and jurisdictions in 2025 were through stablecoins. Russia’s A7A5 and Tether (USDT) made up the majority of these inflows. Between 2024–2025, total flows to and from sanctioned entities and jurisdictions from centralized exchanges decreased by nearly 30%; however, flows to and from high-risk / no-KYC services and decentralized services increased by over 200%. This shift likely reflects multiple factors:
- Improved transaction monitoring and wallet screening by centralized exchanges
- Increasing use of obfuscation tactics by sanctioned actors, such as layering funds through intermediary wallets
- A broader move away from centralized platforms due to heightened risk of detection or asset freezing
2025 saw 21 total crypto-related sanctions designations (and one delisting) across the EU, UK, and US
Sixteen of these designations included cryptocurrency addresses, one of which marked the first time the EU included actual addresses in a sanctions designation. In its 19th sanctions package against Russia, the EU also adopted transaction bans against the payment processor, Payeer, as well as a first of its kind action that prohibited all transactions involving A7A5. Four designations were joint sanctions between the US and allies — most notably the United Kingdom and Australia — largely focused around cybercrime and tackling international scam compounds. 2025 also marked the first de-listing of a sanctioned crypto entity, with the March 2025 de-listing of Tornado.cash following the November 2024 US Fifth Circuit decision.
Across jurisdictions, authorities' growing comfort and investigative abilities with crypto have allowed them to include addresses as identifiers in sanctions designations — especially when addresses are directly tied to designated entities and where authorities have confidence in attribution. These recent designations suggest OFAC and other designating bodies will continue to append wallet addresses where feasible to enhance enforcement.
US crypto-related sanctions priorities shifted between administrations
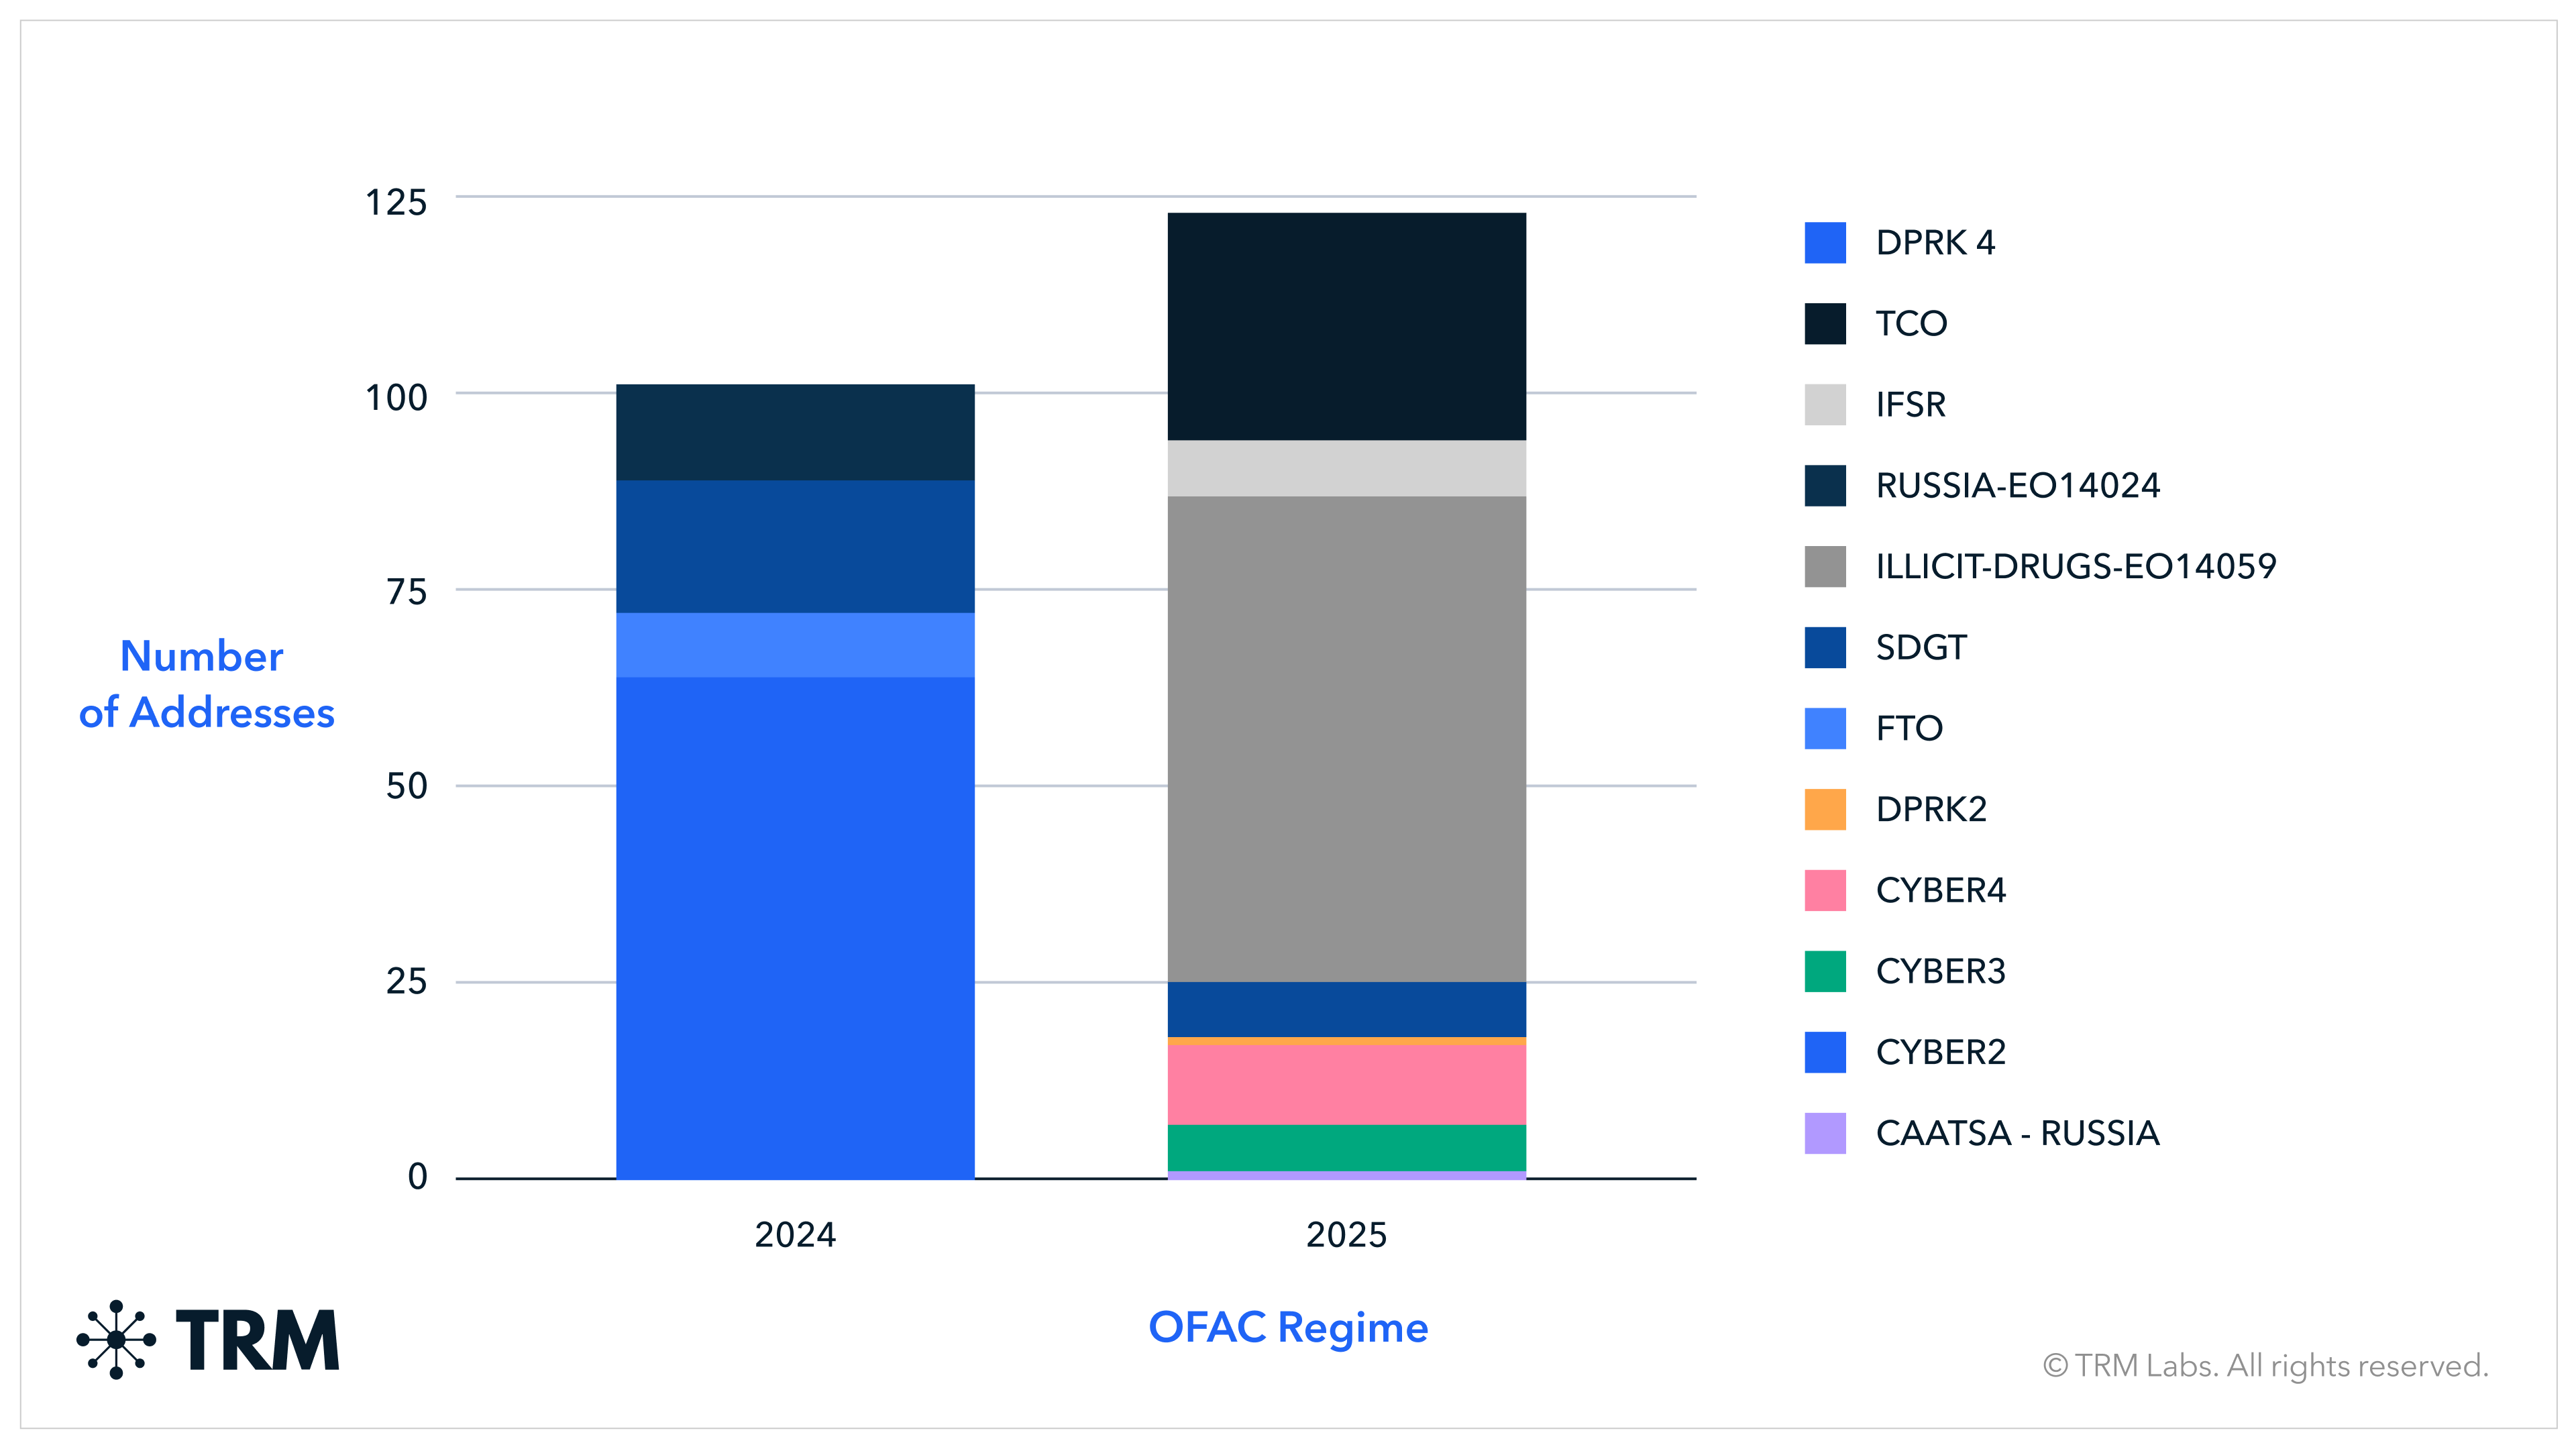
Sanctions designations in the cryptocurrency space reflected a clear shift in executive branch priorities. Just over 50% of addresses designated in 2025 were associated with the illicit drug market, targeting businesses and individuals connected to fentanyl production and distribution. This 2025 change — when taken with other US activity in the Western Hemisphere — suggests US sanctions policy is likely to remain focused on TCOs, illicit drugs and oil, and foreign cyber actors in 2026, with an emphasis on Iranian and Venezuelan entities.
{{premium-content_chapter-divider}}
Strategic global competitors
Russia
<h3 class="premium-content_subhead">The A7 network anchored Russia’s professionalized sanctions evasion effort with over USD 56 billion in volume</h3>
When Russia invaded Ukraine in 2022 — drawing strict international sanctions — cross-border crypto movement became a function for sanctions evasion. By 2025, Russia’s sanctions evasion activity has become institutionalized, consolidating around the A7 network.
A7 is a Kremlin-backed cross-border sanctions evasion platform that has scaled functions previously carried out by smaller, fragmented networks. A leak of internal A7 communications enabled attribution of a large cluster of cryptocurrency addresses, revealing at least USD 56 billion in direct A7-related volume, with additional flows moving through intermediary wallets likely tied to A7 shell companies or foreign trade partners in places like China, Southeast Asia, and South Africa.
On-chain analysis shows over USD 2 billion in bidirectional exposure between A7, sanctioned Russian exchanges Garantex and Grinex, and multiple Kyrgyzstan-registered entities that are likely Garantex-affiliated. Several wallets display indicators consistent with shared infrastructure or overlapping control, suggesting common coordination for sanctions evasion. A7-associated addresses also show exposure to IRGC, Hamas, and sanctioned entities HuiOne and BYEX — highlighting overlap with other high-risk financial networks.
China-based intermediaries supported procurement and payment flows
A7-linked funds moved through intermediaries across multiple jurisdictions, with particularly strong exposure to China and Hong Kong-based entities. TRM Labs identified several Chinese counterparties receiving transaction volumes far exceeding what would be expected given their apparent business profiles, indicating the use of crypto intermediaries possibly based in Hong Kong to process payments on behalf of mainland firms, where cryptocurrency use is restricted.
These entities were frequent recipients of USDT on TRON from A7, A7-affiliated wallets, and entities likely using Garantex infrastructure. Chinese logistics and electronics firms featured prominently. One Chinese freight forwarder agreed to ship missile navigation components to Russia. They received USD 1.31 million from Garantex, with additional funds from a Kyrgyzstan-based Garantex-linked entity. Separately, A7-linked addresses show over USD 37 million in exposure to a Chinese electronics reseller, reinforcing the role of China-based intermediaries in supporting Russia’s wartime supply chains.
Stablecoins facilitated Russia’s cross-border settlement; Russian stablecoin A7A5 value falsely inflated
Stablecoins were central to Russian sanctions evasion activity in 2025, as they were in other heavily restricted economies. While A7A5 saw increased usage within the A7 and Garantex ecosystems, USDT was the dominant settlement asset for cross-border payments.
Approximately 34% of A7A5’s trading volume was likely artificially inflated through wash trading — including rapid, circular transfers consistent with automated behavior — according to TRM analysis. The scale and velocity of these patterns make explanations such as P2P trading or fiat on and off-ramps unlikely. Instead, the activity appears designed to inflate apparent liquidity and build confidence in a relatively novel stablecoin for international trade.
On-chain analysis indicates that A7A5 was used disproportionately in transactions between A7, Garantex, and Kyrgyzstan-based entities that are likely part of the same sanctions evasion network. A7A5 was primarily used to settle transactions between these foreign intermediaries, Russian entities, and trade partners involved in procurement — bolstering TRM’s assessment that A7A5 is meant as an internal settlement mechanism as part of a larger sanctions evasion network, not a globally competitive stablecoin. The pairing of a domestically linked stablecoin with shared on-chain infrastructure underscores the need for innovation and coordination from sanctioning bodies as Russia adapts to sanction regimes.
2025 was the year of the Russian rebrand
Russia-linked crypto services increasingly responded to sanctions and enforcement actions through rapid rebranding and reincorporation. Following the March 2025 international law enforcement operation against Garantex, Telegram channels associated with the platform quickly promoted a successor service, Grinex. On-chain analysis later confirmed continuity between the two, including asset migration facilitated through A7A5.
TRM also identified multiple additional Russia-linked platforms launched in Kyrgyzstan that shared almost identical user interfaces, backend infrastructure, and wallet heuristics with Garantex. ABCeX and its rebrand AEXBit showed similar patterns — such as co-spending into a shared hot wallet — indicating common control. In a similar effort, Russia-affiliated payment processor Cryptomus launched a parallel service, Heleket, which received its initial liquidity directly from Garantex. TRM identified shared characteristics — including coordinated launch timelines, minimal service or compliance changes, and overlapping on-chain infrastructure — confirming our assessment that these services were simply rebranded.
These 2025 rebrands are likely part of a centrally coordinated effort to preserve Russia’s access to international crypto liquidity while insulating core operators from sanctions and legal exposure. Faster attribution, targeting shared infrastructure rather than specific brands, and greater comfort with crypto-specific sanctions may enable authorities to more effectively combat these networks in 2026.
Venezuela
<h3 class="premium-content_subhead">Stablecoins, P2P activity were central to Venezuela’s evolving crypto ecosystem</h3>
In 2025, Venezuela’s cryptocurrency ecosystem was shaped by macroeconomic instability, sanctions pressure, and regulatory uncertainty — contributing to widespread reliance on stablecoins (particularly USDT) for everyday financial activity. Stablecoins are commonly used for retail payments, remittances, and informal financial transactions, reflecting the ongoing depreciation2 of the bolívar and limited access to trusted banking infrastructure. Crypto use is growing fast in Venezuela, which ranked 11th of the top 20 countries by crypto adoption ranking in 2025, according to TRM's 2025 Crypto Adoption Report.
Following the 2023 restructuring of the National Superintendency of Cryptoassets and Related Activities (SUNACRIP), Venezuela’s crypto regulatory environment remains fragmented and opaque. Gaps in formal oversight — alongside persistent peer‑to‑peer (P2P) usage and nested service models operating within global platforms — introduce structural risks, including for sanctions exposure.
Large international exchanges offering P2P functionality continue to play an outsized role, enabling users to convert between bolívares and stablecoins without interacting directly with traditional financial institutions. Alongside these major platforms, a range of informal providers operate via messaging apps and wallet‑to‑wallet transactions. While these channels may support financial inclusion, their informality reduces transparency into counterparties and transactional flows, increasing ecosystem‑wide exposure to financial crime risk.
Government-tolerated platforms coexist with informal rails
In parallel with informal activity, several domestic crypto-enabled payment platforms appear to operate with a degree of government tolerance — offering merchant payments, fiat off‑ramps, and stablecoin‑based services. Some of these entities likely operate under local authorization frameworks and are integrated into domestic payment systems, while others cross multiple jurisdictions — linking stablecoin accounts and regional payment rails, including local banks.
This dynamic reflects a hybrid financial environment shaped by economic necessity, regulatory ambiguity, and ongoing efforts to maintain access to dollar‑linked value.
High‑risk financial infrastructure and stablecoins are likely used in oil settlements
Venezuela’s digital asset activity, while often driven by macroeconomic necessity, also operates within an increasingly complex web of cross-border financial infrastructure. In 2025, stablecoins such as USDT remained central to domestic financial activity and informal FX settlement, but were also observed in transactions that mirror alternative settlement mechanisms used in heavily sanctioned jurisdictions.
Intermediaries operating in and around Venezuela have likely engaged in digital asset activity involving stablecoins, in contexts consistent with oil-linked trade flows. These patterns appear to reflect structural adaptations to limited access to traditional dollar channels and banking infrastructure. In some cases, this activity routes through regional high-risk exchanges or regional and international exchanges operating across multiple jurisdictions.

TRM has also identified exposure involving intermediaries historically linked to high-risk financial networks associated with Iran, Russia, and China. In some cases, these exposures occurred alongside the use of alternative digital assets that may limit traceability or enforcement visibility. These observations highlight the systemic risks inherent in high-velocity stablecoin ecosystems, particularly those operating across fragmented or low-transparency regulatory environments.

{{28-2026-crypto-crime-report-footnote-2}}
Iran
<h3 class="premium-content_subhead">Iran’s crypto economy was resilient under sanctions and conflict</h3>
Iran’s crypto economy largely sustained its engagement across 2024 and 2025, showing how deeply digital assets are now embedded in the country’s financial system. Despite persistent sanctions pressure, heightened enforcement scrutiny, geopolitical disruption, and cyber activity targeting financial infrastructure, Iran’s crypto flows adapted rather than collapsed.
TRM observed approximately USD 11.4 billion in total crypto activity in Iran in 2024 and roughly USD 10 billion in 2025, including both inbound and outbound flows. While activity declined modestly year over year, the scale and consistency of these volumes point to structural demand, not speculative participation. As attribution of offshore intermediaries and broker-mediated settlement continues to expand, observed totals for both years remain subject to upward revision.
War showed consolidation, not collapse
The 12-day Iran-Israel conflict from June 13 to June 24, 2025 served as a stress test of Iran’s crypto ecosystem, and highlighted its resilience under acute geopolitical pressure. During the conflict window, Iran’s crypto volume increased by approximately 35%, while transaction counts declined by roughly 40%. At the same time, average transaction size rose by about 122% when compared to the same time period in 2024.
This divergence points not to reduced crypto usage, but to a consolidation of activity into fewer, larger transfers — a pattern consistent with crisis-driven behavior such as capital flight, balance consolidation, and risk mitigation rather than routine retail trading. Even with network disruptions, heightened sanctions pressure, and active conflict, Iran’s crypto rails continued to function as a reliable channel for moving value when traditional financial pathways were most constrained.
Nobitex adapted under pressure
This consolidation dynamic was visible at the exchange level. In the days preceding Israel’s strikes on June 13, outflows from Nobitex (Iran’s largest cryptocurrency exchange) surged by more than 150% week over week, indicating that users were proactively moving funds off domestic platforms in anticipation of escalation. Shortly after, the Israel-linked group Predatory Sparrow targeted Nobitex in a roughly USD 90 million hack, triggering widespread user distrust and temporary market dislocation. In the aftermath, incoming transaction volumes dropped by more than 70% year over year.
Iran’s domestic crypto ecosystem continued to function despite these shocks. Nobitex resumed service in stages beginning in late June, aided in part by reserves held in bitcoin, including funds consolidated from previously dormant mining-linked wallets. More broadly, activity rerouted through intermediary wallets and offshore services rather than disappearing.
Domestic protests prompted internet shutdown, suppressed participation
In late December 2025, the regime met widespread anti-government protests with aggressive state controls, including near-total internet shutdowns and restrictions on digital services aimed at suppressing mobilization and information flow. This produced a different outcome for the crypto ecosystem than the war earlier in the year.
Between December 28, 2025 and January 16, 2026, Iran’s total crypto volume declined by roughly 60% year over year, while transaction counts fell by approximately 63% compared to the same period in 2024–2025. Though these dates are a defined window, protests and associated connectivity restrictions have continued beyond this period, suggesting that the observed suppression of activity reflects ongoing conditions — not a short-lived shock.
The data shows that retail and small-scale crypto participation was heavily constrained, likely due to internet outages, fear of surveillance, and restricted access to exchanges. While hundreds of millions of dollars still moved on-chain, activity narrowed to a smaller set of higher-capacity actors able to operate through disruptions. In short, external conflict accelerated capital movement, while domestic unrest limited who could participate at all.
Share of total Iranian illicit activity flows remained stable
In 2025, illicit Iranian crypto volume totaled just over USD 580 million, representing approximately 5.9% of observed activity. In 2024, illicit activity accounted for roughly 5.1% of total observed volume, or approximately USD 600 million. While absolute illicit volume declined slightly in line with overall activity, its share of total flows remained stable — reinforcing the view that illicit and sanctions evasion usage is structurally embedded. As additional illicit activity is identified, these figures remain subject to upward revision.
Across both years, Iran’s illicit activity was overwhelmingly concentrated in stablecoins particularly USDT. This preference likely reflects USDT’s liquidity, low transaction costs, and compatibility with broker-mediated settlement networks. At the margins, actors continued to layer transactions using alternative assets and routing techniques — but these methods complemented, rather than replaced, USDT as the core settlement asset.
Case study: Inside an IRGC-aligned crypto exchange network
TRM analysis identified two cryptocurrency exchanges incorporated in the UK that processed hundreds of millions of dollars in stablecoin transactions while functioning as offshore financial infrastructure linked to Iran’s Islamic Revolutionary Guard Corps (IRGC). Although the entities — registered in the UK as Zedcex and Zedxion — publicly presented themselves as conventional crypto trading platforms, on‑chain and corporate records indicate that they operated as a single exchange enterprise embedded within a broader sanctions evasion ecosystem.
Between 2023 and 2025, a substantial share of Zedcex’s activity involved wallets linked to IRGC‑controlled entities. In 2023, IRGC‑linked flows accounted for roughly USD 24 million, representing approximately 60% of observed activity. That share rose sharply in 2024, when IRGC‑linked volume increased to around USD 620 million (or nearly 90% of total flows) before declining to approximately USD 410 million in 2025 as non‑IRGC‑linked activity increased. Across this period, Zedcex processed close to USD 1 billion in IRGC‑associated transactions, primarily in USDT on the TRON blockchain, a combination which offers low fees, deep liquidity, and broad broker acceptance.
Corporate records show that the two exchanges were incorporated in the UK using virtual office addresses, overlapping directors, and repeated dormant filings, despite the scale of activity observed on‑chain. The sequencing of their incorporation and leadership changes suggests continuity rather than separation of operations. Earlier corporate control was linked to Babak Morteza Zanjani, a financier previously sanctioned by the US and EU for facilitating Iran‑linked sanctions evasion. The Zedcex case reflects a broader pattern in which exchange‑branded crypto infrastructure operates offshore while maintaining functional ties to sanctioned economies.
On‑chain tracing connects Zedcex‑attributed wallets directly to addresses designated by Israeli authorities as IRGC property and blocklisted by stablecoin issuers. Funds were routed between IRGC‑controlled wallets, offshore intermediaries, and domestic Iranian exchanges — integrating sanctioned flows into Iran’s broader crypto economy. In at least one instance, TRM observed direct transfers exceeding USD 10 million from Zedcex‑linked infrastructure to a US‑designated terrorist financier associated with the IRGC, without intermediary routing.
Taken together, these findings illustrate a shift in sanctions risk: rather than episodic abuse of crypto rails, sanctioned actors are increasingly operating or embedding themselves within crypto financial infrastructure itself, raising fundamental questions about platform control, beneficial ownership, and the limits of traditional compliance approaches.
{{premium-content_chapter-divider}}
Crypto hacks and exploits
<h3 class="premium-content_subhead">Operational compromise drove USD 2.9 billion in losses</h3>
In 2025, illicit actors stole USD 2.87 billion across nearly 150 distinct hacks and exploits.3 While incident volume remained broadly consistent with recent years, the severity of losses increased sharply due to a structural shift in attack vectors: adversaries moved up the stack, targeting operational infrastructure — keys, wallets, and control planes — over smart contract code.
The landscape was defined by the massive Bybit breach in February, which accounted for USD 1.46 billion (51%) of all funds stolen in 2025. This concentration of loss, in which the top 10 incidents represented 81% of the annual total, signals a maturing threat environment. Sophisticated actors, particularly those linked to North Korea (DPRK), are no longer just exploiting code — they are compromising the operational foundations of crypto asset services and the ecosystems around them.
{{28-2026-crypto-crime-report-footnote-3}}
Sophisticated actors drove a concentration risk
.png)
The annual totals for hacks in 2025 were weighted heavily toward larger hacks — in some cases, catastrophic failures. While the average incident size rose to USD 19.5 million, the median incident size fell to USD 1.3 million. In 2025, just five events accounted for 70% of all stolen crypto value.
This widening gap illustrates a “long tail” risk environment: a handful of mega-heists drive global loss figures, while a high volume of smaller incidents continues to inflict persistent damage across the crypto ecosystem.
Attack vectors pivoted to infrastructure
TRM’s dataset classifies hacks and exploits into five top-level categories: Infrastructure Attack, Code Exploit, Protocol Attack, Unknown, and Other. In 2025, the disparity between operational compromise and on-chain exploitation was clear — infrastructure attacks drove the clear majority of losses.
.png)
While Code Exploits were the most frequent category (52 incidents), they accounted for a comparatively smaller share of total losses (USD 350 million, 12.1%) — about USD 6.7 million per incident on average. Protocol Attacks were less frequent (25 incidents) but more severe on average (USD 277 million, 9.6%) — roughly USD 11.1 million per incident.
By contrast, Infrastructure Attacks — which include compromises of private keys / seed phrases, wallet infrastructure, privileged access, and front-end surfaces — drove USD 2.2 billion in losses (76%) across 45 incidents, averaging approximately USD 48.5 million per incident. The dominant 2025 pattern was therefore operational compromise, often enabled by social engineering, developer environment penetration, or weaknesses in access controls and withdrawal governance.

The Bybit breach defined the trend
The February 2025 Bybit breach — which TRM assesses was carried out by North Korean operatives — was the defining event of the year. With USD 1.46 billion stolen in a single event, Bybit distorts annual totals. But it also clarifies the threat reality.
Even excluding Bybit, 2025 losses would have totaled USD 1.4 billion, underscoring a persistent baseline of criminal activity. More importantly, the breach validated a long-observed dynamic: for top-tier adversaries, the highest ROI increasingly lies in compromising operational infrastructure (keys, signers, wallet orchestration) at centralized entities instead of discovering novel logic errors in smart contracts.
North Korea and the Chinese laundromat
TRM Labs attributes USD 1.92 billion to North Korea-linked actors (DPRK) in 2025. The 2025 data also reflects a continued evolution in how stolen assets are processed after theft. DPRK operators increasingly rely on “Chinese laundromat” networks — a term used by investigators to describe professionalized OTC brokers and underground intermediaries that facilitate off-ramping and settlement at scale.
These networks provide subcontracted laundering: high-volume OTC brokers absorb stolen assets and settle off-chain, distancing the theft operation from the cash-out point. They also facilitate chain hopping and fragmentation: rapid movement across chains and services to break traceability and route liquidity toward cashout channels. This professionalization complicates recovery, as the faster stolen assets can be routed through layered intermediaries, the narrower the window for interdiction.
For additional details, see North Korea and the Industrialization of Cryptocurrency Theft.
The operational imperative for 2026
The data from 2025 shows that the primary risk surface is operational. Smart contract audits are necessary, but they are no longer sufficient.
The shift toward infrastructure compromise emphasizes the criticality of hardware-backed key custody and strict signer isolation, withdrawal governance (including velocity controls and tiered approvals to limit the blast radius of compromised access), and operational security hardening for developer environments and privileged systems. Additionally, typology-driven monitoring that goes beyond entity screening to detect complex cross-chain routing consistent with industrialized laundering would enable a more proactive response.
{{premium-content_chapter-divider}}
Scams
<h3 class="premium-content_subhead">The fraud landscape evolved through converging typologies</h3>
Actors sent approximately USD 35 billion in cryptocurrency to fraud schemes in 2025 alone, on par with the value received last year at USD 38 billion. This figure reflects a combination of funds traced to confirmed fraud-linked wallets and additional victim-reported scam addresses submitted through public reporting and incident response channels.
While TRM’s current dataset shows a decrease in fraud volumes, this should not be interpreted as a decline in real-world fraud activity. Fraud reporting is often delayed, with victim disclosures taking weeks or months to surface. Additionally, the vast majority of victims never report at all, due to factors such as embarrassment, fear of reputational harm, uncertainty about where to report, skepticism that funds can be recovered, or lack of awareness that a crime has occurred. As a result, observed fraud totals almost always understate the true scale of activity, even as reported figures continue to rise over time.

In 2025, TRM observed USD 23 billion in verified fraud and an additional USD 12 billion tied to community complaints. As scammers become more sophisticated and adapt quickly, community complaints and shared reporting networks are increasingly critical for surfacing new scam wallets early, accelerating attribution, and disrupting fraud before losses scale further.
Crypto fraud is increasingly dominated by organized groups operating with business-like structure, specialization, and efficiency. Scam operators openly share tools and techniques, reuse proven playbooks, and run recruitment pipelines that resemble legitimate hiring processes.
In addition to financial theft, many large scam operations are connected to scam compounds, which can employ human trafficking, coercion, and violence — with some maintaining relationships with local power structures. Governments have started more direct enforcement, including through sanctions targeting entities and individuals linked to scam operations.
Investment scams dominated, but tactics converged
As in previous years, investment-related schemes accounted for the majority of observed victim losses, representing 62% of 2025 fraud inflows. Within this category, TRM observed victim losses tied to pig butchering scams and pyramid / Ponzi schemes, which continued their streak among the most prominent subtypes.

Task / work-from-home scams have also emerged as a driver of victimization. These campaigns direct victims to fake platforms offering paid micro-tasks such as writing reviews, clicking advertisements, or “optimizing” content. Victims are shown fabricated account balances and earnings, then pressured to pay fees, deposits, or taxes to withdraw funds. While individual losses vary, job scams often scale through high-volume targeting, resulting in large aggregate harm even when per-victim losses are lower than in more elaborate long-con schemes.
A defining trend in the current state of crypto fraud is the convergence of distinct scam typologies. Victim journeys increasingly span multiple phases of deception, combining elements of romance scams, investment fraud, and advance fee schemes. Pig butchering exemplifies this overlap: a scam might begin with a romantic connection, shift into a false investment opportunity, and end with the scammer demanding additional funds under the guise of taxes or administrative fees. Although social engineering remains a key component of fraud campaigns, it is now reinforced by technical and organizational innovations that make fraud more scalable and harder to detect.
This layered approach reflects fraud networks’ broader shift toward more sophisticated campaigns. Networks operate more like enterprises, deploying specialized teams and standard playbooks to target and exploit victims at scale. Supporting this evolution is a growing ecosystem of illicit service providers. Some offer AI-as-a-service tools to automate outreach and engagement, while others sell phishing kits or provide access to breached data. These services lower the barrier to entry for fraud actors and enable them to replicate scams across geographies.
Scam networks adapted to enforcement and improved laundering discipline
Scam operators have evolved their laundering tactics in response to enforcement pressure. In past years, large amounts of stablecoin funds often remained parked for extended periods, creating opportunities for freezing or investigative intervention. Since 2024, however, many fraud-linked networks have reduced holding times, often moving funds onward within 48 hours.

Scammers have also increased the complexity of how they move and manage funds on-chain. To complicate freezing and tracing, they often convert proceeds into less freeze-prone assets such as ETH or DAI, then briefly shift into stablecoins like USDT or USDC closer to cash-out points. This shift is reflected in TRM’s balance data: across 2024 and 2025, the average value held in scam-linked wallets declined sharply, suggesting faster turnover and shorter holding periods.

AI tools scaled fraud operations
Fraud networks are increasingly leveraging generative AI to boost outreach, impersonation, and persuasion, with AI-enabled scam activity rising by roughly 500% over the past year.
Large language models (LLMs) enable scams to cross language and cultural contexts with less friction, while AI-generated images, voice cloning, and deepfake videos reduce the cost of creating convincing personas. These capabilities are expanding impersonation-style scams across messaging platforms, recruitment campaigns, and investment fraud — and they increase the likelihood that victims can be deceived even when aware of scam warnings.
As outlined in TRM Labs’ The Rise of AI-Enabled Crime Report and related publications, AI tactics such as voice cloning have powered impersonation scams across WhatsApp, fake job recruitment sites, and giveaway campaigns — many of which now use fabricated deepfake endorsements from celebrities like Elon Musk.
As discussed in TRM’s 2025 Crypto Crime Report, another common typology is non-investment related authorized push payment (APP) scams, where victims are manipulated into transferring funds to imposters posing as tax authorities, financial professionals, or lawyers.

AI-generated multimedia is increasingly used in investment fraud campaigns. Scam operators now routinely employ generative tools to create professional-looking branding assets for websites and social media, including logos, images, and in some cases videos featuring deepfake avatars. This reduces setup costs and makes it easier to rapidly rebrand, recycle infrastructure, and launch new scam iterations at scale.
Stablecoins dominated verified fraud inflows, capturing 84% of fraud volumes
On the inflow side, TRM’s verified fraud dataset showed that stablecoins are the primary vehicle for deposits into fraud schemes, and their share grows meaningfully year over year. In 2024, stablecoins represented ~70% of fraud inflows, rising to ~84% in 2025. This reflects fraud actors’ continued preference for assets that offer high liquidity, broad exchange acceptance; easy denomination for victims; and frictionless movement across addresses and services.

Pyramid and Ponzi schemes remained a major driver of losses
In 2025, pyramid and Ponzi schemes received approximately USD 6.1 billion in victim funds, marking a 49% increase compared with 2024 and broadly in line with levels observed in 2023. This increase was driven in part by growth in the number of large schemes receiving over USD 100 million, which rose to 13 in 2025, compared with six in 2024 and 14 in 2023.
TRM Labs identified new iterations of previously observed decentralized investment fraud schemes that re-emerged in 2025, with operators collapsing and reconstituting them with largely identical infrastructure. These pyramid-like operations are structured around multiple smart contracts frequently promoted as transparent and supposedly unchangeable. In practice, however, most participants lack the technical capacity to independently assess the underlying code and verify its legitimacy.
While major pyramid and Ponzi schemes operate on a global scale and appear to spread opportunistically across jurisdictions, TRM analysis indicates that several of the largest schemes in 2025 proliferated most strongly in developing markets and economically vulnerable communities. For example, CBEX, which received approximately over USD 250 million in victim funds, gained significant traction in Nigeria; while Treasure NFT, which received approximately USD 800 million, spread extensively in India and Pakistan.
Case study: Prince Group’s crypto laundering infrastructure and the role of HuiOne Pay
Prince Group is one of the largest pig butchering scam operations ever uncovered. In October 2025, the US and UK imposed sanctions on a number of individuals and entities related to what they called the Prince Group Transnational Criminal Organization. An indictment was filed simultaneously by the US Department of Justice (DOJ), charging the founder and chairman of Prince Group, Chen Zhi, with money laundering conspiracy for directing Prince Group’s operation of forced labor scam compounds across Cambodia.
How the laundering pipeline worked
According to the indictment, Chen and Prince Group allegedly laundered fraud-derived funds through a variety of methods — including the use of professional money laundering organizations and by routing money through Prince Group’s legitimate business operations, including two mining companies: Warp Data and Lubian Mining. From there, funds seem to have been sometimes sent to Chen himself.
It is possible to trace a clear connection between bitcoin mining activity, Lubian Mining specifically, and a substantial portion of the 127,271 bitcoin seized by the US on the blockchain. Based on the allegations, victim funds were likely laundered and converted into fiat, then used to purchase mining equipment and support related operational expenses. Because much of this process occurs off-chain, it can be difficult to fully trace these connections using blockchain data alone.
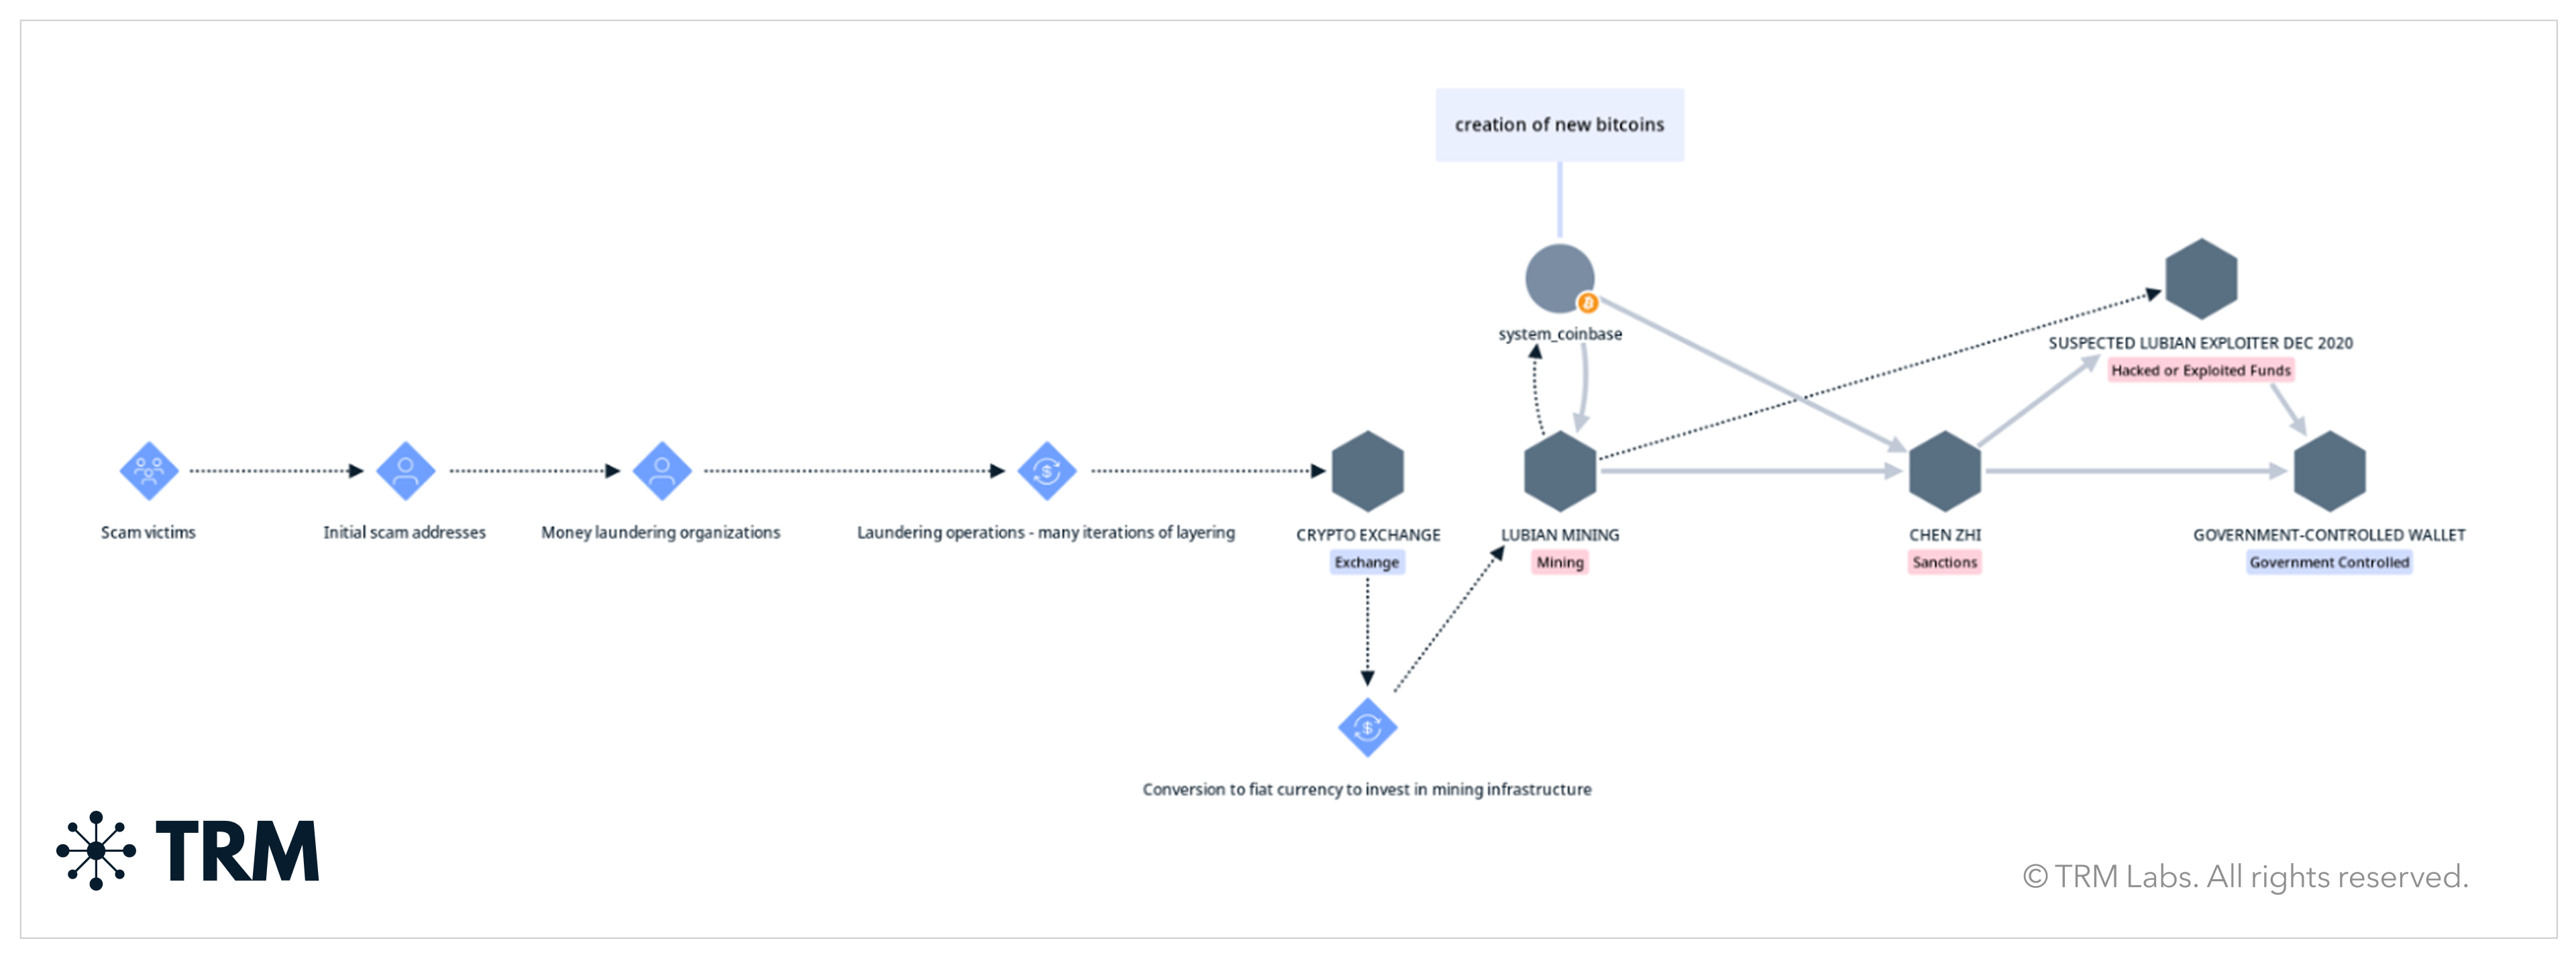
Financial connections may shift off-chain through operational expenses, infrastructure purchases, and energy costs — making the traceability picture more complex. This enables a layered laundering model where an organization can continuously recycle proceeds through hybrid on and off-chain steps, reducing exposure signals while preserving liquidity and control.
HuiOne Pay as a high-volume financial gateway
Sanctioned Cambodian conglomerate HuiOne Group is a key financial enabler for Prince Group-linked illicit activity, including scam compounds operating in Southeast Asia. TRM identified a Prince Group-linked escrow service that sent almost 80% of its funds to HuiOne Pay-linked wallets, demonstrating direct fund flows from a Prince-associated node into HuiOne’s payments infrastructure.
This level of dependency matters because facilitator nodes provide repeatable pathways, high-throughput routing, and access to services that make large flows operationally manageable. When a scam enterprise relies on a single facilitator at this scale, that entity becomes a structural dependency that can accelerate fund movement, shrink the interdiction window, and expand downstream risk for institutions that may interact with connected activity.
HuiOne Pay functions as a high-leverage facilitation layer that can move and concentrate funds at scale. That scale is visible in its activity over time: incoming volume grew from tens of millions per month in early periods (for example, roughly USD 44 million in December 2020) into sustained multi-billion-dollar monthly inflows by 2024 and 2025, peaking at approximately USD 4.7 billion in July 2025. That kind of consistent, high-volume throughput is what makes this kind of facilitator infrastructure so valuable.

HuiOne Pay suspended operations and halted withdrawals following an apparent bank run as of December 2, 2025. Activity levels seem to reflect that disruption: after moving multiple billions per month throughout much of 2025, incoming volume fell sharply to around USD 803 million in November 2025, and approximately USD 100 million in December 2025. It is not immediately clear whether these liquidity issues and the subsequent run were a direct result of coordinated measures taken against HuiOne and Prince Group.
Mapping networks and behaviors to strengthen enforcement
One of the key lessons of the Prince Group case is that major scam organizations often maintain operations under enforcement through adaptation — including wallet rotation, shifting intermediaries, restructuring routing paths, and distributing activity across new clusters. Known exposure then becomes outdated quickly, and reliance on static watchlists can create blind spots. However, the behaviors persist: how the system consolidates, how it stages liquidity, and what facilitators remain consistent over time.
This adaptation is why mapping the entire system — and how it interacts — matters. The most durable signals for disruption are often tied to infrastructure and operational chokepoints, not single identifiers. If the architecture remains intact, the organization can keep moving value, even when individual wallets or entities are removed from the ecosystem.
This case has several implications for compliance and investigative teams. Scam exposure is often not limited to direct victim-to-scam transactions, and it increasingly manifests through layered flows that touch intermediaries before reaching liquidity venues. Mining-linked activity can be used for value transformation rather than a pure profit-seeking operation, introducing traceability challenges. Facilitator nodes can create dependencies that function as both risk amplifiers and disruption opportunities, particularly when they act as repeatable routing channels.
{{premium-content_chapter-divider}}
Ransomware
<h3 class="premium-content_subhead">Ransomware activity remained elevated in 2025 as victim claims surged</h3>
Ransomware remains one of the most persistent forms of cybercrime, with attackers encrypting systems or stealing data and demanding crypto payments to restore access or prevent public leaks.
In 2025, ransomware-linked crypto inflows remained high, though they did not reach recent peak levels. While reported payment volumes appeared steady, ransomware operations became more aggressive, with a sharp rise in victims posted to leak sites, signaling increased attack activity and extortion pressure. The growing gap between rising victim claims and flatter payment totals suggests more targets are resisting demands or recovering without paying.
New ransomware groups flooded the ecosystem
Alongside rising victim claims, the ransomware ecosystem also saw an increase in the number of active and newly emerging variants. Internal intelligence cross-referenced with open-source reporting indicates that 93 new ransomware variants emerged in 2025, a 94% increase from 2024. By year-end, the broader ecosystem had expanded to 161 active variants, including newly observed groups such as Beast, Business Data Leaks, Crypto24, Devman Group, Sinobi, and SafePay. This fragmentation trend has intensified since 2023; BlackFog’s 2024 State of Ransomware Report identified 48 new ransomware variants in 2024, an estimated 65% increase from 2023. In 2025, disruptions and ecosystem churn drove an unprecedented volume of new entrants.
Several factors are likely driving this rapid growth. Major disruptions against high-profile groups such as LockBit, BlackBasta, BlackSuit, and ALPHV/BlackCat fractured established ecosystems and displaced affiliates, developers, and access brokers — many of whom regrouped and rebranded or launched independent operations. At the same time, the maturation of ransomware-as-a-service (RaaS) lowered barriers to entry, with leaked tooling, off-the-shelf playbooks, and increasing pressure on legacy brands making splintering and relaunching an attractive survival strategy. Collectively, these dynamics have amplified churn across the ransomware landscape, accelerating the formation of new groups at a pace not seen in prior years.
Among the ransomware groups that emerged in 2025, SafePay claimed the most victims, reaching 452 as of December 2025, according to Flashpoint data. SafePay is notable for rejecting the affiliate-based model common across much of the RaaS ecosystem — but its performance still reflects the broader pattern shaping 2025 ransomware outcomes: high victim volume does not necessarily translate into proportionate ransom revenue, reinforcing indications that a growing share of victims are choosing not to pay.
Ransomware activity is also becoming more distributed across strains by annual value received. When active strains are grouped by the total value they received over the year, the breakdown shows increases across the lower and mid tiers, alongside high-earning strains. This shift reinforces that 2025’s proliferation is not only driven by a growing long tail of smaller operations, but also by newer strains reaching higher revenue levels as the ecosystem becomes more competitive.
On-chain laundering used bridges, mixers, and reversion patterns
Ransomware actors evolved their post-payment laundering behaviors in 2024 and 2025, likely in response to enforcement and heightened monitoring of high-risk services. TRM data indicates a clear shift in how threat actors move funds after receiving payments, with increasing preference for cross-chain mechanisms that offer flexibility in routing and access to new liquidity venues.

Over this period, bridge-related activity grew by 66%, while mixer-related activity declined by 37%. This divergence suggests that many actors have deprioritized traditional privacy-enhancing services in favor of faster cross-chain movement — even though these flows can remain highly traceable when patterns repeat across incidents or affiliates.
Major disruptions scattered but did not extinguish ransomware groups
2025 was a year of unprecedented disruption in the ransomware ecosystem. Disruptions of high-profile groups such as LockBit, combined with the ongoing efforts of Operation Endgame to defuse the major enablers of the ecosystem, fractured established networks and affiliates. However, the ransomware ecosystem has responded by reaching an all-time high for new variants in 2025: 93. These disruptions have influenced some established variants — like Akira — to become more sophisticated in their activities.
Case study: Akira shows operational scale and laundering sophistication
Akira remained one of the most active ransomware groups in 2025, alternating with Agenda / Qilin as the most prolific by leak site victim volume. Akira took in USD 150 million in 2025 alone — almost twice as much as the second most active strain, Agenda / Qilin.

Active since 2023, Akira operates as a RaaS model and uses double extortion tactics, combining encryption with threats to publish stolen data. Its victim set spans multiple sectors and geographies, and public reporting has tied the group to several high-profile incidents affecting large institutions and service providers.
Targeting and geography
Akira has impacted organizations worldwide, with victims concentrated in the United States, Canada, Brazil, Australia, and several European countries. Its targeting spans a wide range of sectors; public reporting has connected Akira to several high-profile incidents, including Stanford University, Nissan Australia, and the Finnish IT provider Tietoevry.
Actor lineage and technical notes
Security researchers have noted code and operational similarities to the Conti ransomware ecosystem, suggesting possible overlaps in developer tooling or shared affiliates.
Overlaps include links to Russia, with evidence pointing to developers based in Russia or the broader post-Soviet region. Notably, unlike many ransomware groups operating out of Russian-speaking regions, Akira’s malware does not include the typical safeguard that halts execution when a Russian keyboard layout is detected. Nevertheless, several indicators point to Russian origin, including observations of the group communicating in Russian on dark web cybercrime forums.
Operational and on-chain evolutions
Throughout its activity, Akira has iterated on its data-theft mechanisms, negotiation style, and targeting patterns — indicating an adaptive RaaS model that continues to evolve despite increased scrutiny.
Akira ransomware has undergone at least four distinct evolutions in its post-payment laundering TTPs.
Phase I (2023)
Early Akira payment flows can be grouped by likely “affiliate” based on consistent on-chain behaviors, including the reuse of intermediary addresses, wallet clusters receiving funds from multiple victim payments, shared cash-out points, and other observable transactional patterns.
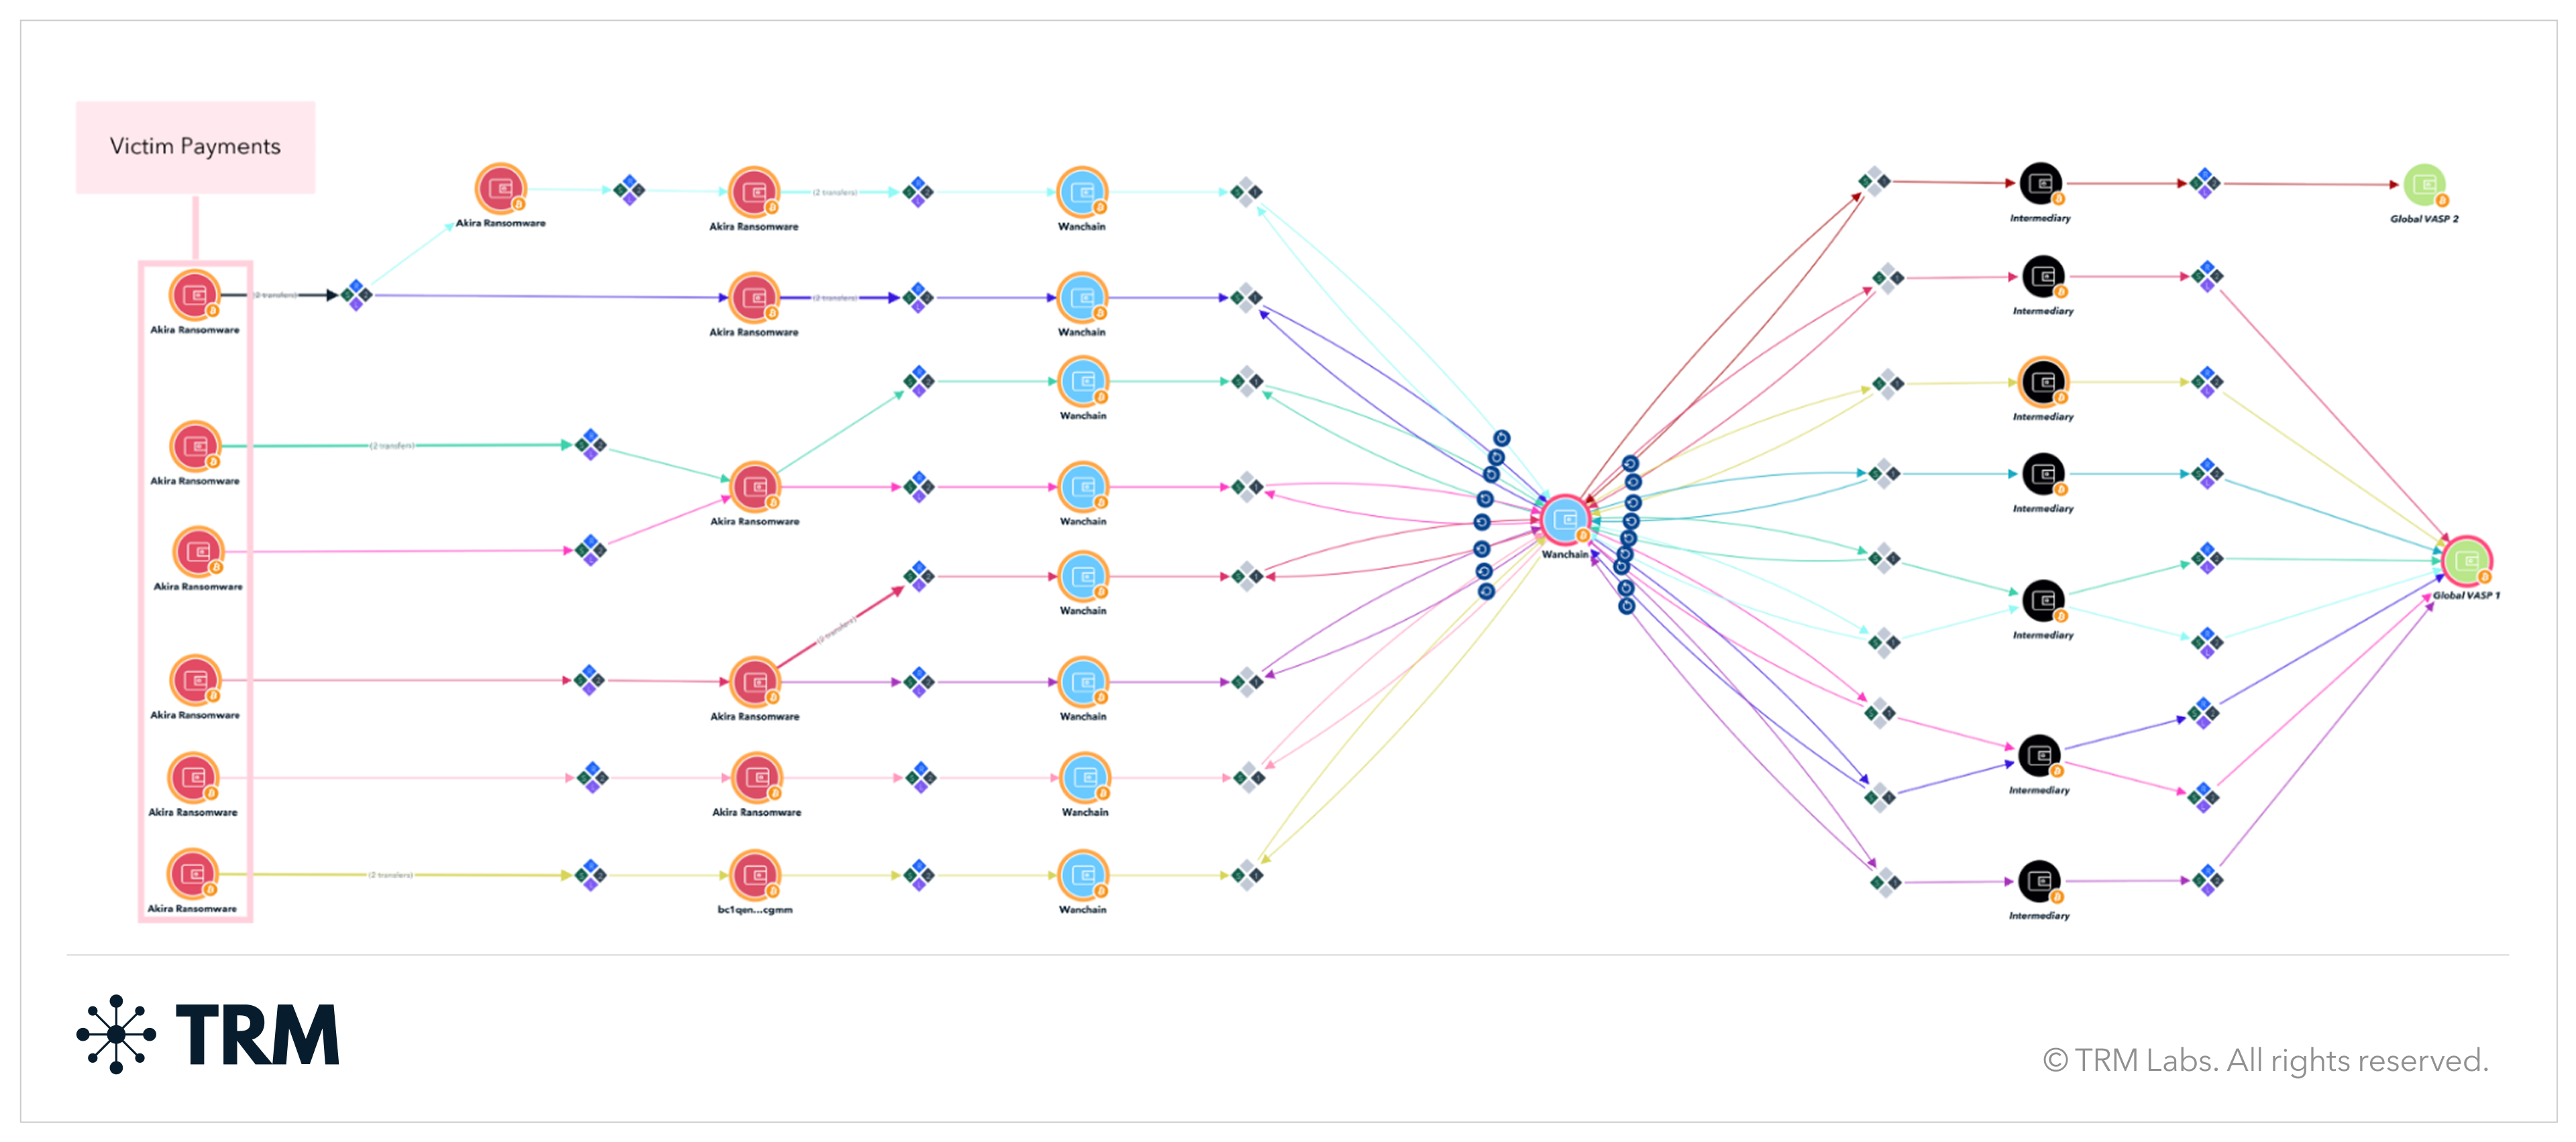
Phase II (early–mid 2024)
Akira shifted to a more standardized laundering process using WanChain — with most victim payments funneled through a single WanChain address before being cashed out across multiple global VASPs.
Phase III (late 2024)
The group transitioned to routing all proceeds through the Defiway bridge. During this period, FOG ransomware employed the same laundering approach, reinforcing indications of overlap or cooperation between the two groups.
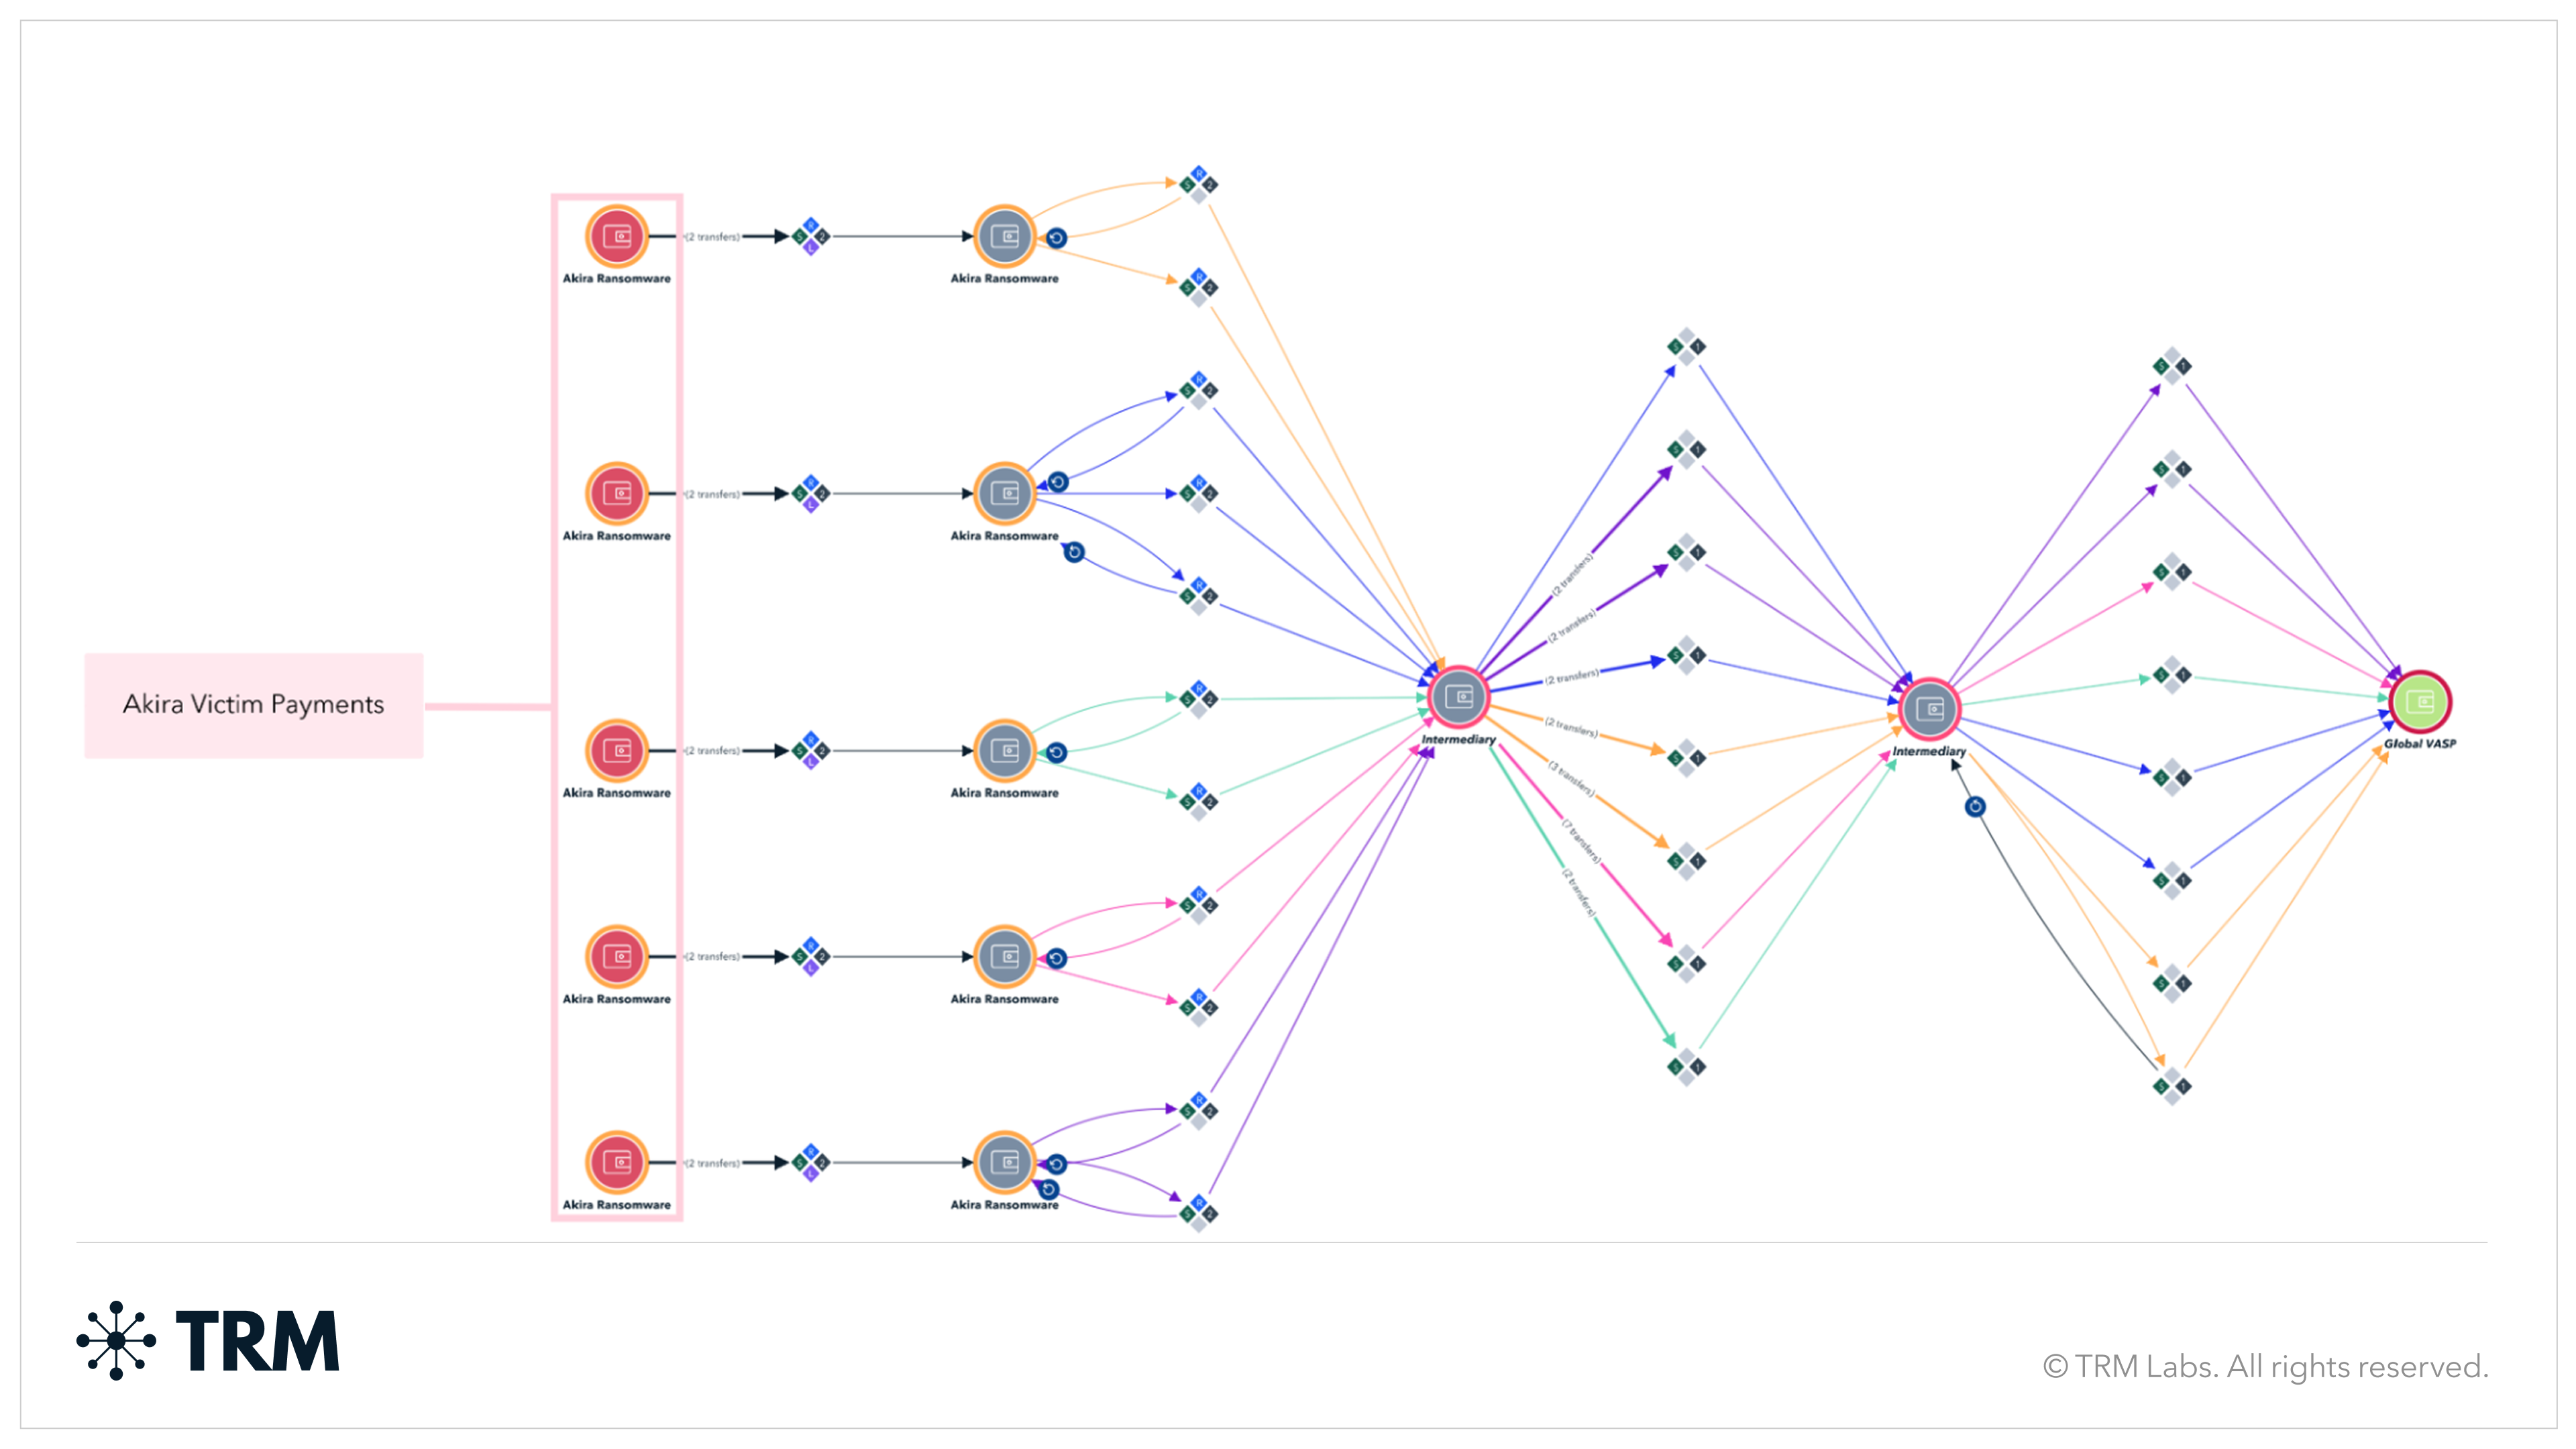
Phase IV (August 2025–present)
Akira once again altered its laundering workflow. Each payment now passes through a unique intermediary address, followed by movement through two consolidation addresses, before ultimately being off-ramped at the same global VASP.
Despite operating as a RaaS, Akira’s laundering patterns remain highly standardized. The admin–affiliate split remains opaque on-chain, as it likely takes place only after the funds are deposited into the same global VASP cash-out address.
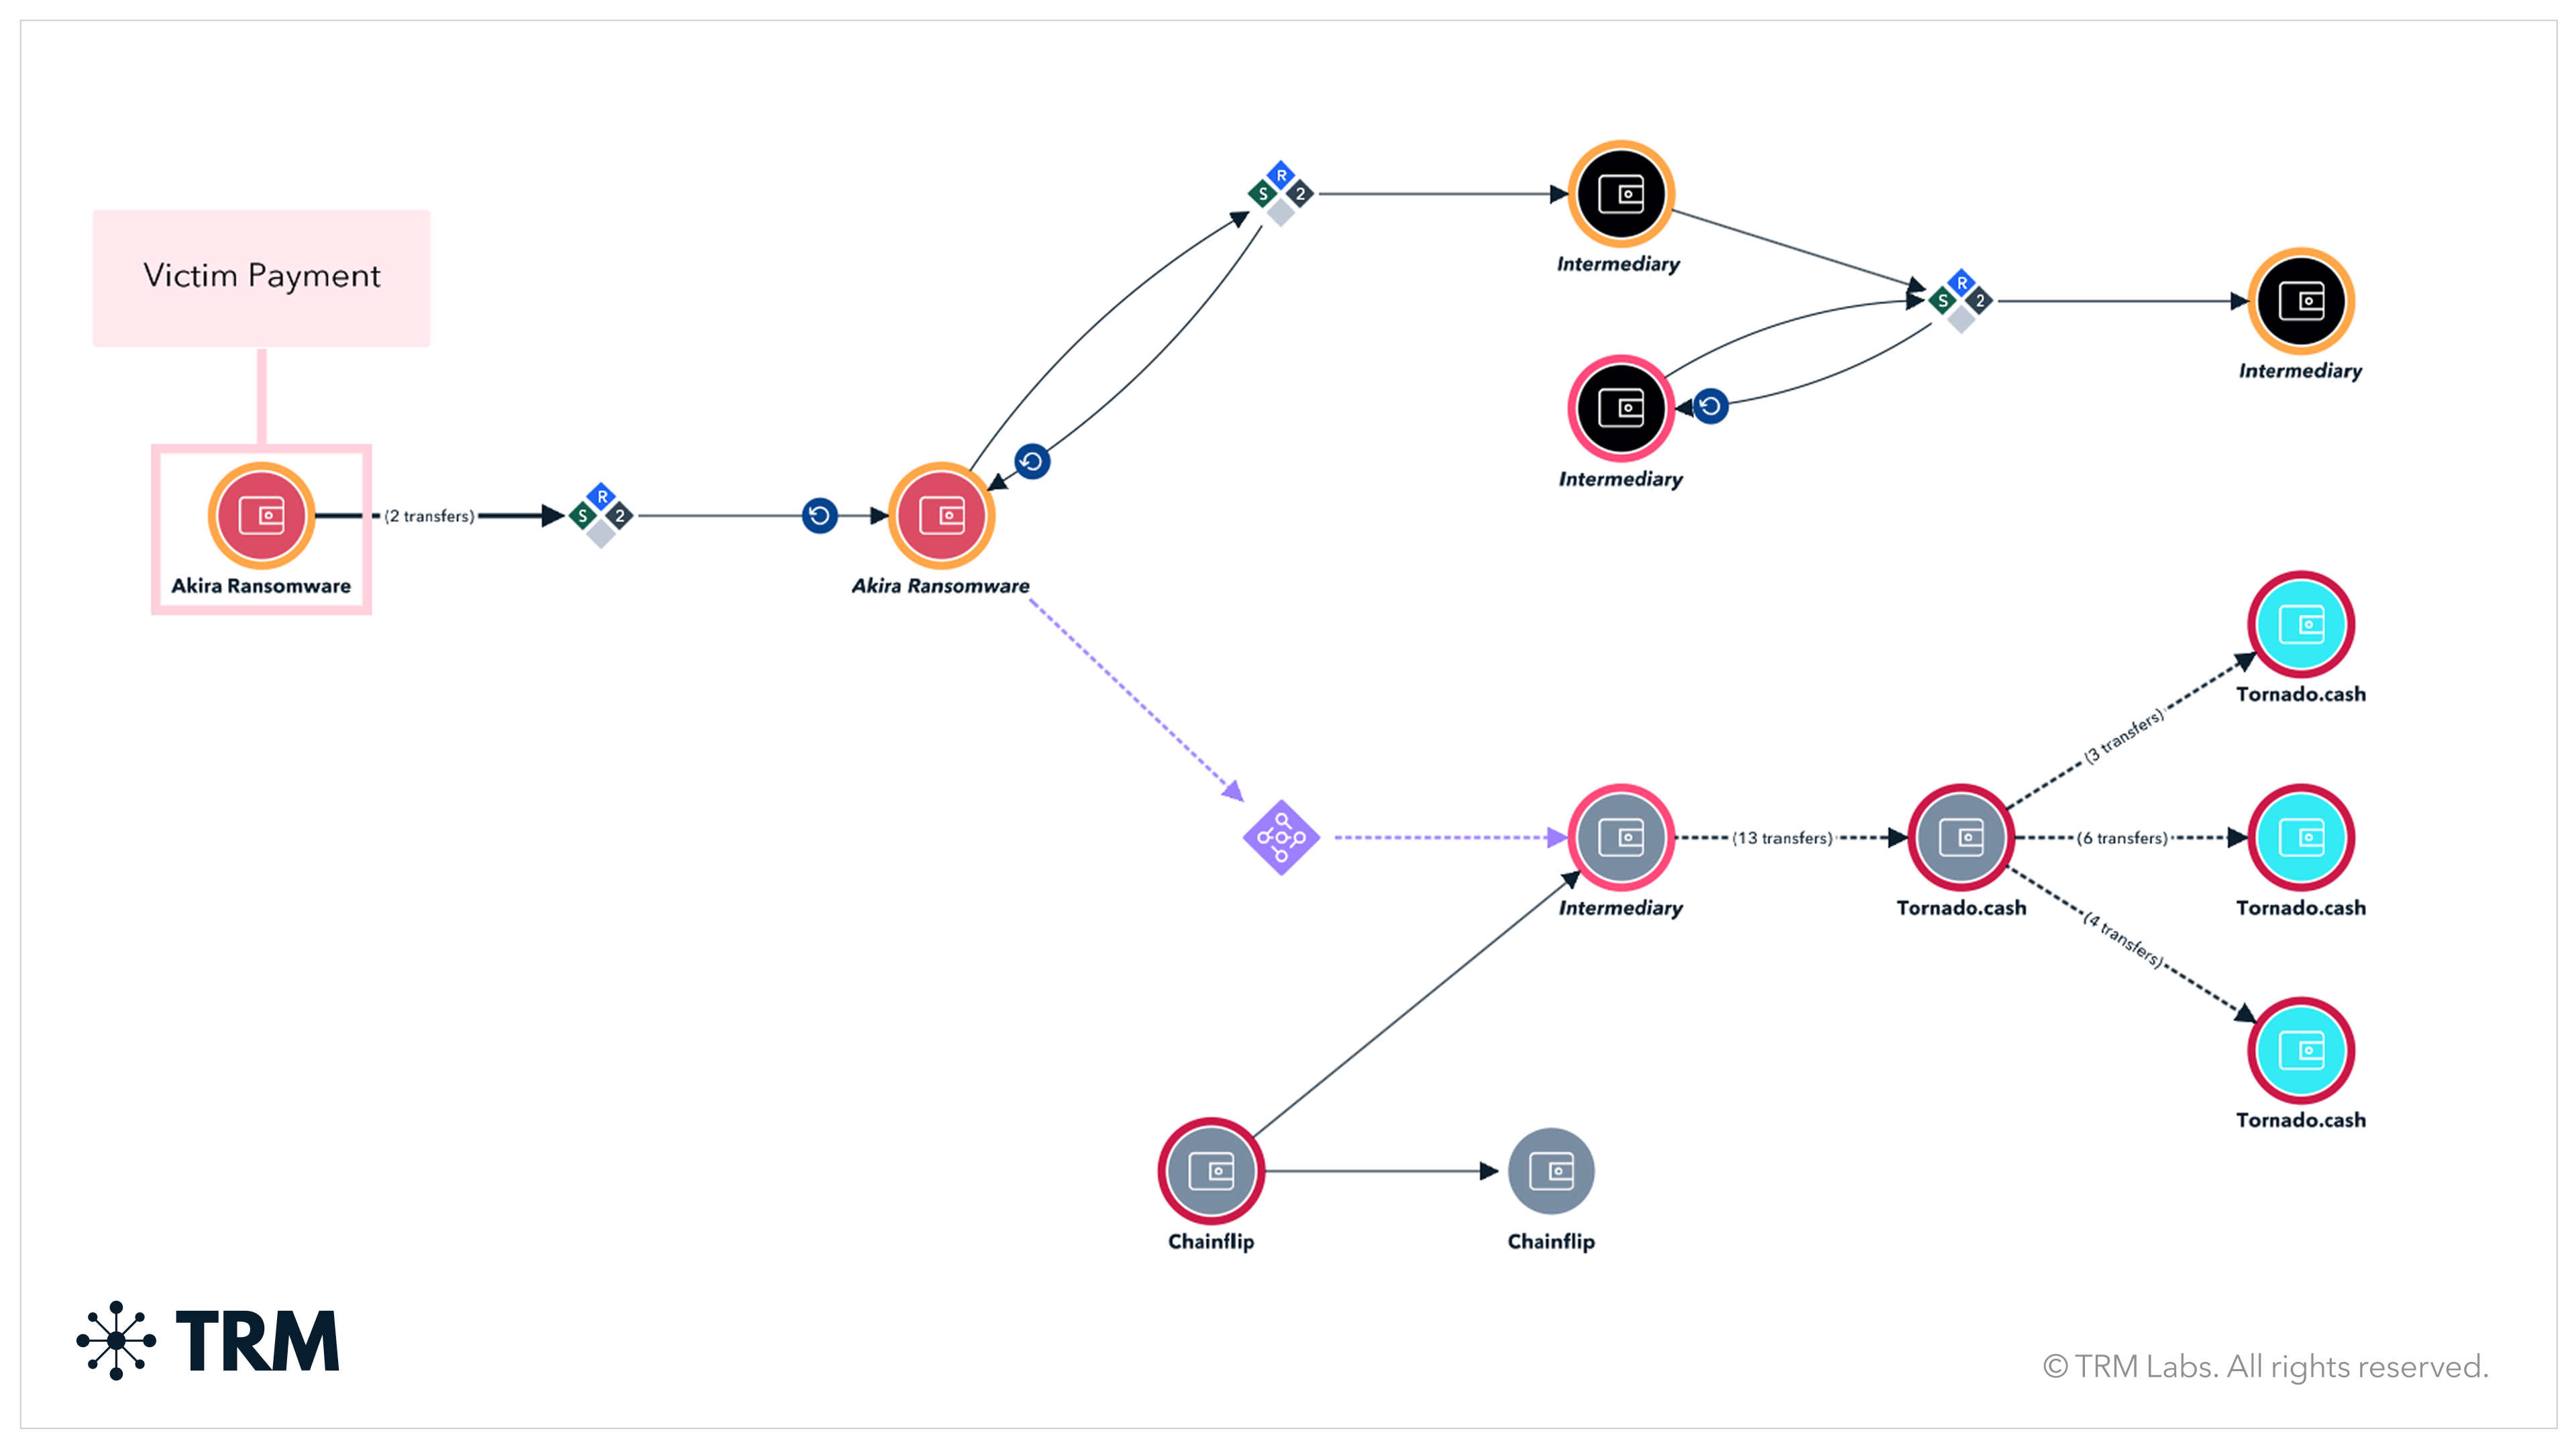
Recent activity suggests isolated deviations from Akira’s current established laundering pattern, with victim funds first moved through cross-chain swaps before being deposited in full into Tornado Cash. This behavior may indicate either affiliate-level divergence from standardized laundering procedures or the early stages of the group’s next evolution in laundering TTPs.
Akira in 2026 and beyond
Akira’s demonstrated willingness to evolve tooling, shift laundering infrastructure, and diversify its targeting suggests the group will continue refining tradecraft to preserve revenue streams and affiliate engagement. Defenders should expect increased speed in post-payment cash-out activity, more sophisticated attempts to fragment transaction flows, and continued expansion into sectors with lower security maturity but high operational impact.
{{premium-content_chapter-divider}}
Illicit drugs
<h3 class="premium-content_subhead">Russian-language darknet markets, cartels, and Chinese money laundering networks reshaped online drug markets</h3>
Darknet marketplaces — driven almost entirely by Russian language marketplaces — generated 20% more incoming volume in 2025
The online illicit drugs trade generated over USD 3.4 billion in total incoming cryptocurrency volume in 2025. Darknet marketplaces alone received USD 1.7 billion, marking a 20% increase from 2024. Consistent with previous years, this activity is overwhelmingly driven by Russian-language darknet marketplaces, which accounted for more than 90% of total darknet market (DNM)-related volume. In contrast, activity across Western darknet marketplaces that rely on cryptocurrencies with visible public ledgers remained effectively flat at approximately USD 60 million.
Meanwhile, wallets associated with the sale of banned or controlled substances — which include independent illicit drug vendor shops — received USD 1.6 billion, a nearly 45% drop from the previous year’s USD 3 billion. Discounting the volume generated in privacy coins like Monero, this suggests relative stability in Western markets while underscoring that the Russian-language ecosystem continues to expand the scale of the global DNM landscape.

Russian-language DNMs dominated, and Monero use accelerated
The 2025 global breakdown of DNM activity shows an ecosystem dominated by Russian-language actors. This imbalance is due in part to market structure: Russian-language DNMs operate in an environment with limited enforcement capacity and high corruption. This creates conditions for sustained profitability for these actors and allows them to reinvest their profits in the same ecosystem, creating exponential growth. Incoming volume to Russian-language DNMs grew by roughly 20 percent year over year, from USD 1.3 billion in 2024 to USD 1.6 billion in 2025, enabling marketplace operators to continue investing in platform development and user acquisition.
In contrast to previous years, which showed falling numbers of new marketplaces, 2025 reversed this trend with 21 new markets.4 The share of newly launched Monero (XMR)-only marketplaces also continued to rise, with nearly half of new DNMs supporting only XMR — a trend most pronounced in the Western ecosystem, where enforcement pressure is typically higher and demand for privacy coins is greater.
.png)
Individual vendor drug sales were down, but Chinese precursor manufacturers continued a sharp upward trend
While the value received by darknet marketplaces soared and new marketplaces emerged, drug sales through individual vendor shops fell by more than 60% in 2025 to approximately USD 1 billion, down from USD 2.75 billion in 2024. This decline could reflect a shift in vendor behavior toward the relative security and infrastructure offered by darknet marketplaces compared to individual vendor shops, as well as reduced visibility into independent vendors as they update financial infrastructure more frequently.
Chinese drug precursor manufacturers stood out as a rapidly growing component of the ecosystem. Incoming volume to individual vendors accelerated in 2023 to USD 30.9 million, with growth continuing through 2024 (USD 34.7 million) and 2025 (USD 39.1 million) — indicating a resilient market for precursor supply tied to synthetic drug production. Even amid sustained enforcement pressure, the continued expansion of these inflows suggests persistent demand and an established base of buyers that transact with precursor vendors at scale.

Overall, 2025 shows that online drug markets are not only growing, but also restructuring. Activity remains heavily concentrated in darknet marketplaces instead of individual vendors, even as new platforms continue to emerge and more adopt XMR-only payments in response to enforcement. At the same time, the continued rise in Chinese precursor shop inflows highlights the durability of the upstream supply chain that sustains fentanyl and other synthetic drug production.
{{28-2026-crypto-crime-report-footnote-4}}
Case study: Cartels, Chinese money laundering networks, and the adaptability of Chinese fentanyl precursor supply chains
Synthetic drug supply chains are supported by a complex ecosystem of specialized service providers. Mexico-based trafficking organizations generate substantial proceeds from the sale of fentanyl and other synthetic opioids, while upstream production of precursors and synthetic opioids such as nitazenes — which generally occurs in China — depends on reliable access to chemical pre-precursors, industry know-how, technology, and cross-border settlement mechanisms that can operate across jurisdictions, given the global reach of their operations.
Chinese drug precursor manufacturers are the dominant global supplier of chemicals used to make synthetic drugs. These suppliers have remained active even under enforcement pressure — reflecting both persistent demand, and the adaptability of upstream manufacturing and logistics networks. Cartels — which play various roles in the receipt, processing, and distribution of the synthetic drug precursors and finished synthetic drug products — rely on intermediary financial actors to facilitate payment and laundering. Chinese money laundering organizations (CMLOs) and cartel-associated money launderers (CAML) move and conceal drug-linked proceeds and support settlement with upstream suppliers.
TRM estimates that the sums laundered by CAMLs reach into the billions of dollars, with all-time volumes reaching over USD 3 billion as of January 2026 — the bulk of which has been generated in the past two years as cryptocurrency has increasingly become part of the money laundering cycle due to its speed, ease of access, and security. The chart below illustrates this dynamic on-chain, showing funds flowing from cartel-linked wallets through laundering networks and onward to precursor vendors.

CMLOs play a critical role within the cartel laundering architecture, sitting between two major sources of liquidity: large pools of cash originating from China (often connected to wealthy Chinese individuals seeking to circumvent the country’s capital controls) and large sums of drug-tainted cartel cash that needs to be laundered.
To move these funds, CMLOs take cartel-linked cash and place it with non-China-based intermediaries, businesses, and contacts associated with China-based clients. CMLOs then receive settlement payments from China-based counterparties and transfer value back to cartels through a range of channels, including trade-based money laundering (TBML). CMLOs typically charge cartels relatively low commissions, but can charge much higher fees to capital flight clients and capture the spread as profit.
By outsourcing laundering and settlement functions to professionalized networks, cartels can reduce friction in cross-border payments, accelerate turnover, and limit direct exposure. For law enforcement, financial intermediaries in these networks are key points of vulnerability, particularly where laundering entities also support other forms of illicit activity.
Case study: Western darknet marketplaces adopt Russian-style “dead-drop” delivery, raising the risk of violence
In 2025, some Western darknet market platforms began experimenting with dead-drop delivery, a fulfillment model typically associated with Russian-language DNMs. A defining feature of the Russian-language ecosystem, dead-drops are a fundamentally different approach to distribution built around localized, offline delivery networks — not postal shipments typical to Western DNMs. This model, which can be traced back to Cold War-era tradecraft, has shaped illicit drug markets in Russia and the former Soviet space by enabling regional operations and near-immediate fulfilment.
The dead-drop model is a version of geo-caching, whereby vendors place illicit drugs in various public spaces and inform buyers of their locations instead of mailing illicit drug orders. One advantage is that this model greatly reduces the time between order and delivery and encourages hyper-local distribution networks, with vendors often serving only a small area. This aspect has contributed to the substantial profits generated by Russian-language darknet marketplaces — entities which in Russia and the post-Soviet space have overwhelmingly replaced on-street sales.5
TRM identified at least two Western DNMs where this delivery method is used alongside the typical postal delivery system. The first is Scandinavian marketplace MoominMarket, launched in the summer of 2025. MoominMarket hosts a variety of Swedish, Danish, and Finnish vendors who offer dead-drops across several large cities in the region.
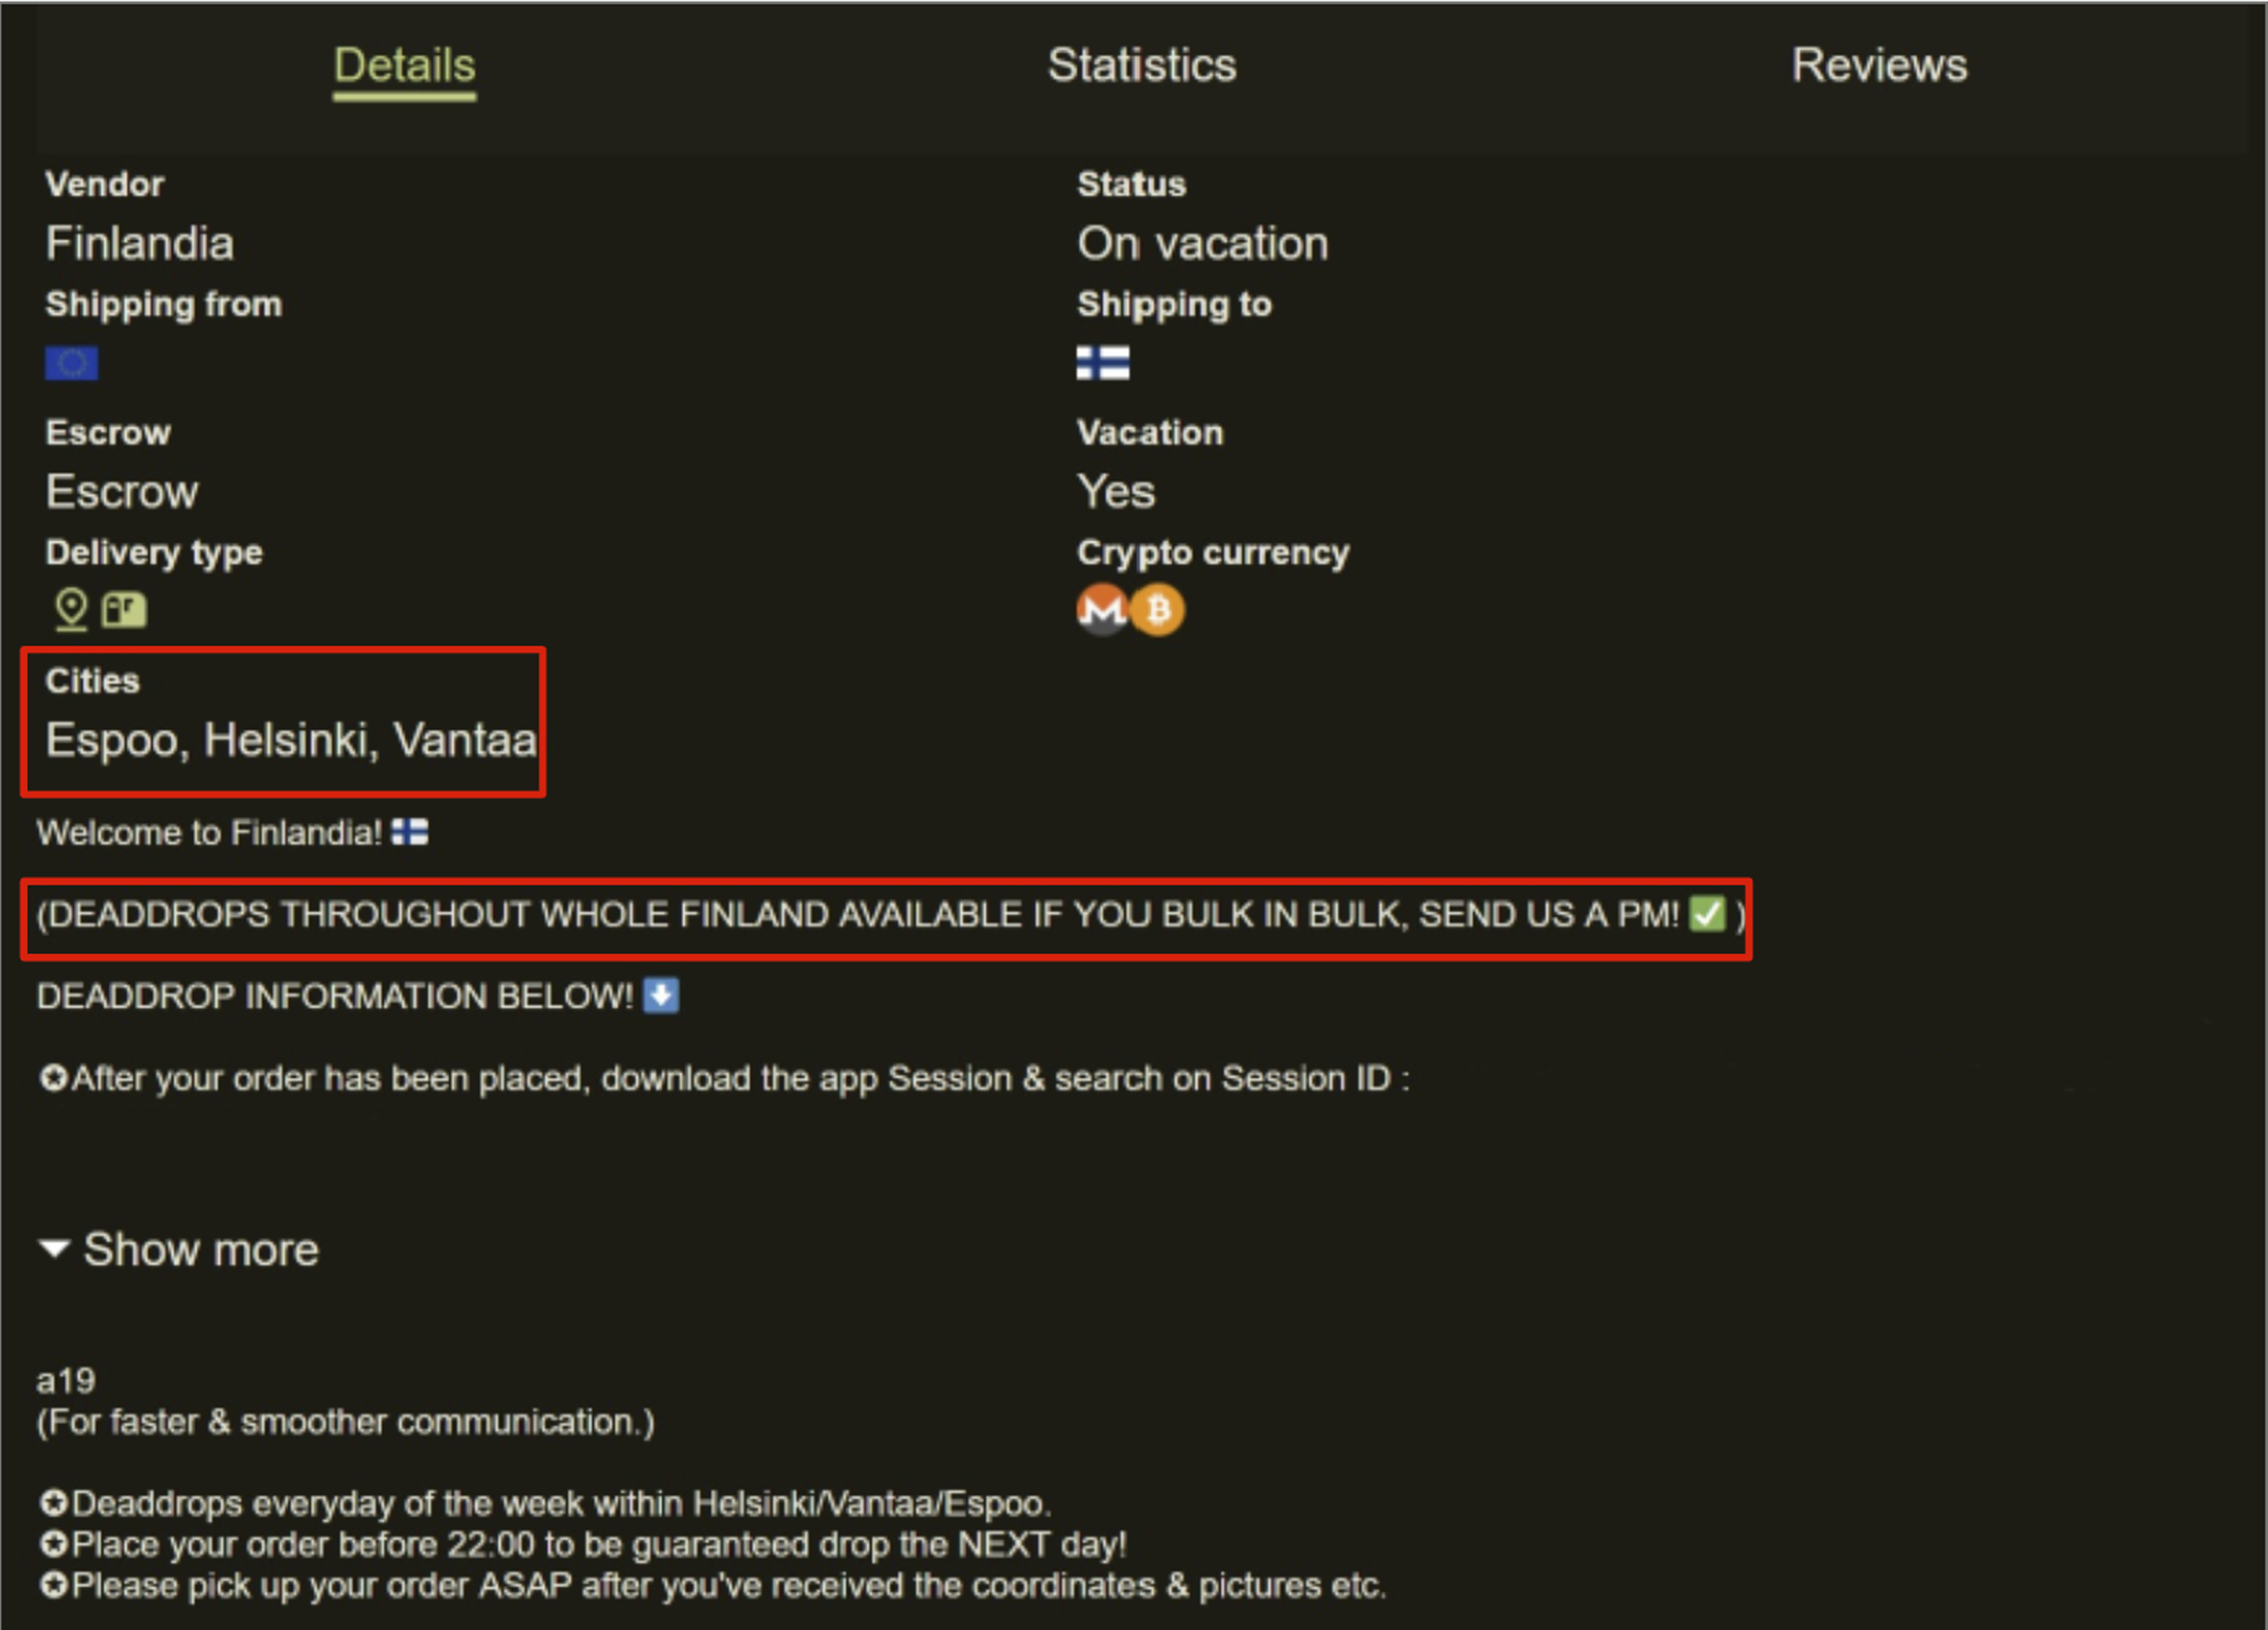
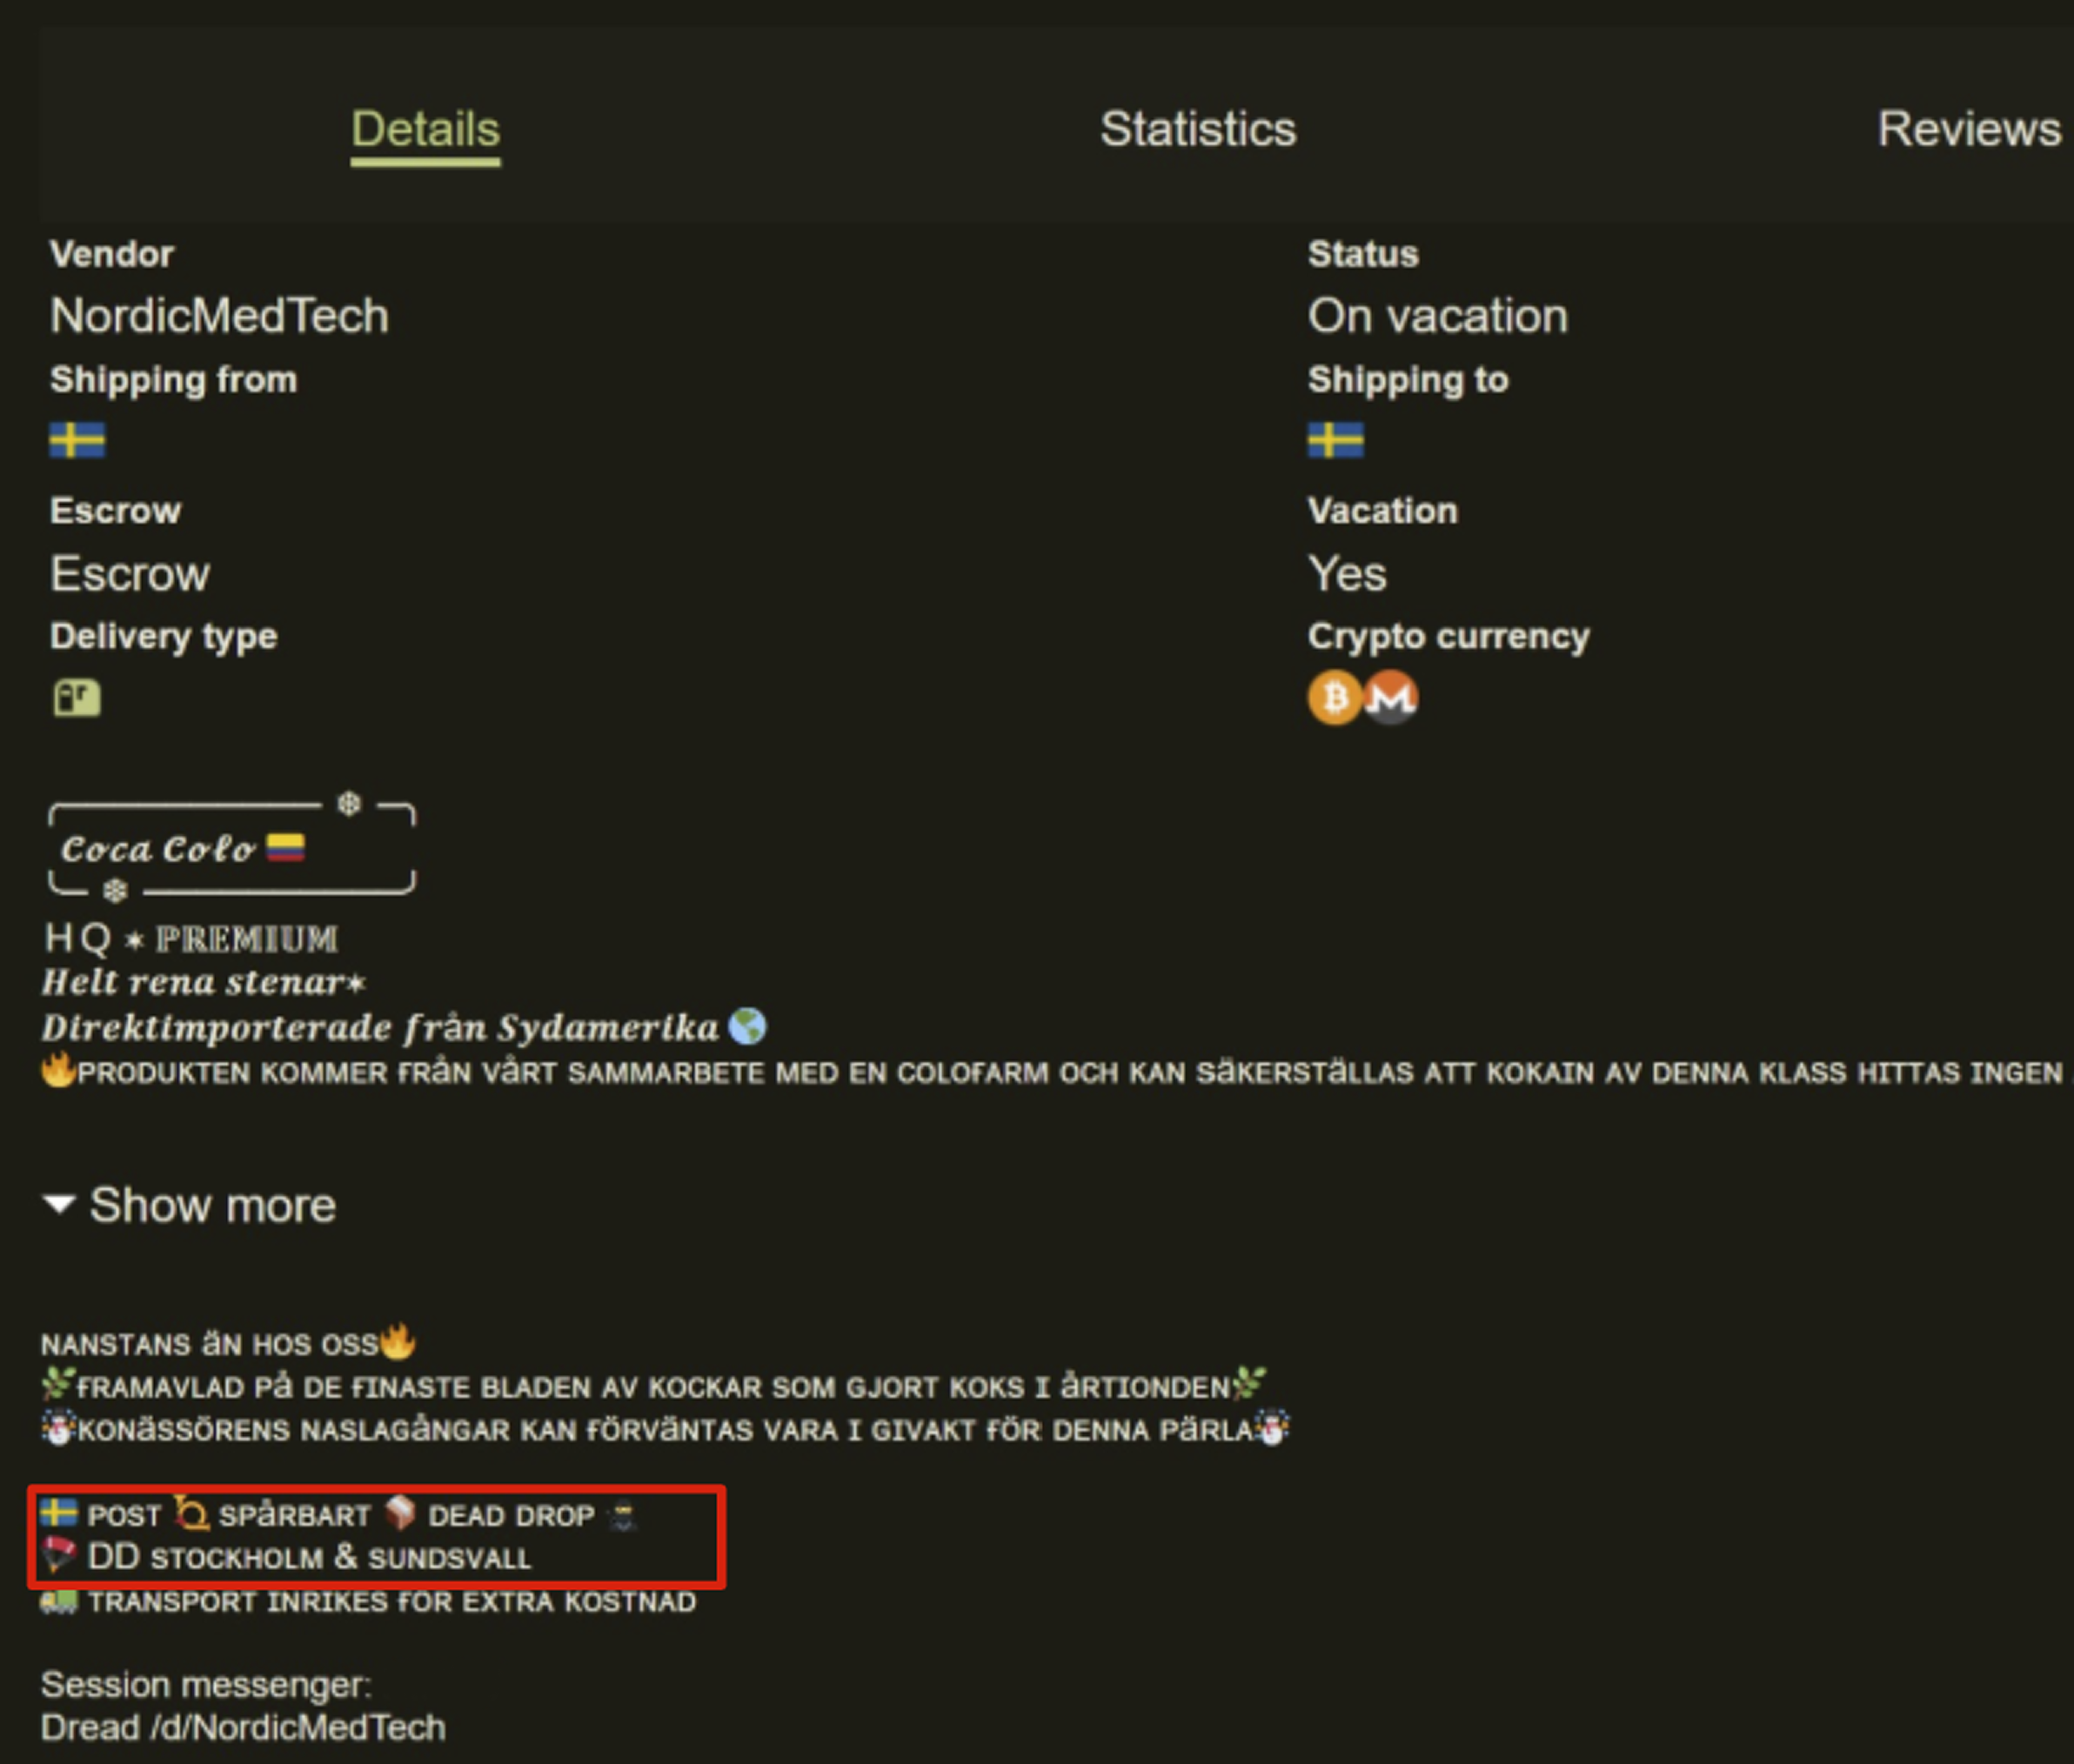
The second is hybrid Russian-Western DNM Bazaar, which emerged from a user forum called BreakingBad. Bazaar is aimed at a Western audience, but is likely administered by a Russian or Russia-based moderator. BreakingBad discusses dead-drops in an apparent effort to promote them across Western markets, which has carried over into Bazaar itself — which offers postal delivery and dead-drops. Bazaar has advertised on Russian-language channels as an alternative to established Russian DNMs in an unusual attempt to bridge Eastern and Western ecosystems.
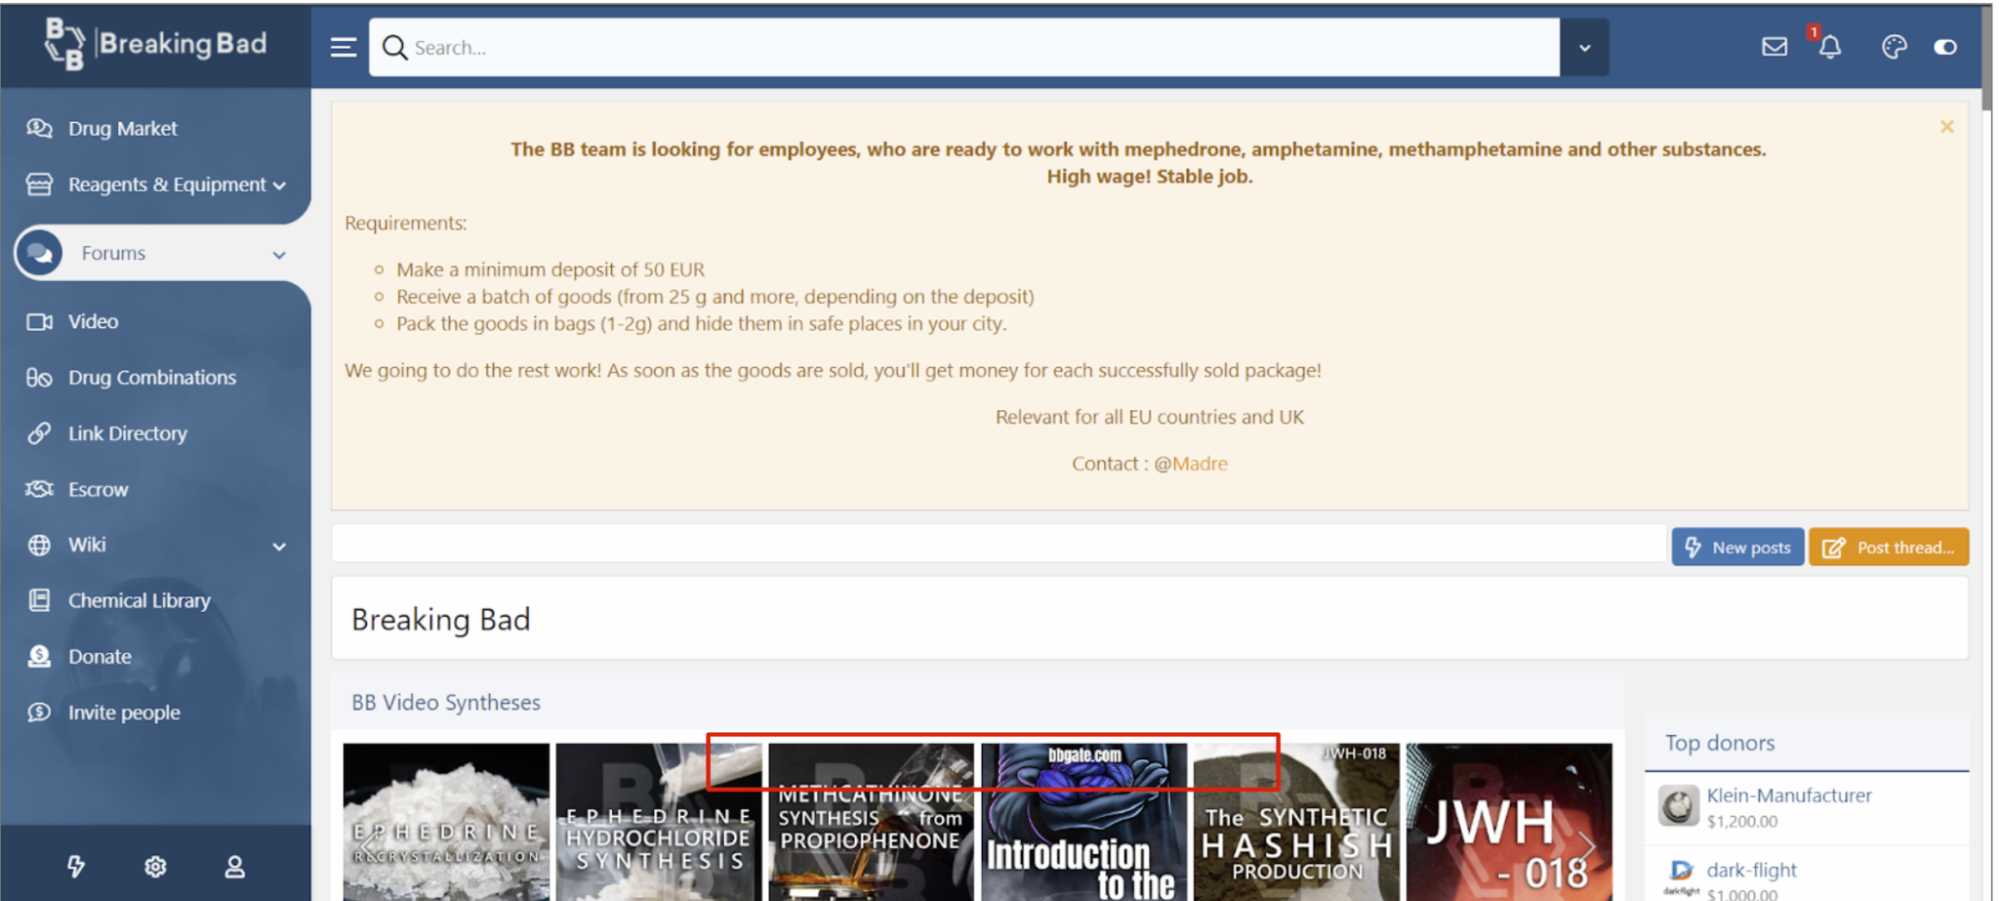
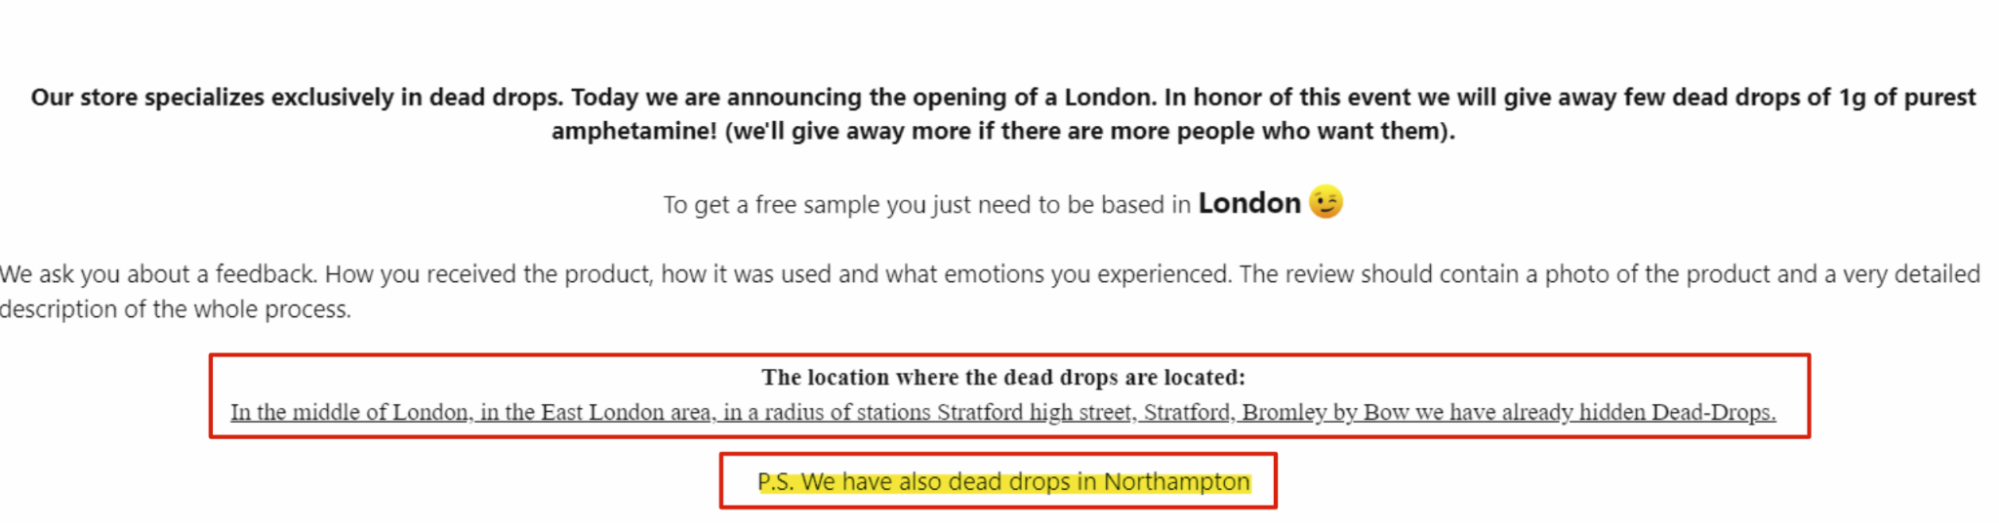
A broader shift toward dead-drop delivery in Western DNMs would introduce several risks, including an increased likelihood of violence within the fulfillment layer of the illicit drug supply chain. Unlike postal delivery, which outsources delivery to legal postal networks, the dead-drop model depends on on-the-ground networks, including couriers and distributors (“kladmen”) responsible for placing packages in public locations.
This structure increases exposure to loss and diversion, since stashes (“klads”) can be stolen either by couriers themselves or by opportunistic third parties (“seagulls”). To mitigate these risks, some vendors employ dedicated enforcers (“athletes” or “sportsmen”) to monitor drop areas, investigate theft, and use intimidation or violence against individuals believed to be interfering.
Local conditions in Russia, including law enforcement constraints, have historically made dead-drops easier to execute. If dead-drops were to be employed by Western drug markets, this could result in similar risks — such as drugs in public places or violence regularly used as an enforcement mechanism within drug vendor networks.
{{28-2026-crypto-crime-report-footnote-5}}
Case study: Chimera Marketplace shows Russian-language DNM expansion beyond core markets
Chimera Marketplace emerged in August 2025, and initially seemed structurally consistent with Russian-language DNMs. But what makes Chimera different is that it serves jurisdictions outside of Russia and post-Soviet countries, notably Thailand (including Bangkok, Phuket, and Pattaya) and select locations in India.6 Russian-language DNMs have historically operated only in Russia and post-Soviet states. TRM has observed Chimera employing offline marketing tactics in Goa, using QR-code stickers to advertise their services in public.
Neither Thailand nor India have established domestic DNMs. Although Chimera is likely primarily targeting Russian-speaking users, it employs a localized, city-based marketplace model focused on users and vendors in that area, as the platform’s activity is oriented toward local fulfillment.
Chimera likely represents an expansion of the mature Russian-language DNM model into geographies where local demand exists but local marketplaces have not scaled. If replicated elsewhere, this could influence how online drug distribution develops in new regions, including through increased adoption of Russian tactics such as dead-drops and associated operational risks.
{{28-2026-crypto-crime-report-footnote-6}}
{{premium-content_chapter-divider}}
Money laundering
<h3 class="premium-content_subhead">The maturing laundering economy executed settlement at scale</h3>
Money laundering enables illicit funds to be moved, layered, and reintegrated across jurisdictions back into the traditional financial system. When considering cryptocurrency, one method for estimating money laundering is to look at funds leaving illicit wallets and the services to which they flow. In 2025, over USD 60 billion of value left illicit wallets and landed at different services. Across recent years, the largest share of volume routes through VASPs and other service infrastructure, illustrating how illicit actors depend on intermediaries.
As illicit networks professionalize, more of the laundering lifecycle is visible after the initial crime. Activity increasingly stays on-chain through service providers, settlement layers, intermediary brokers, and repeat counterparties instead of ending at the first cash-out event. The result is that the “post-illicit” stage is becoming a larger and more quantifiable component of the illicit finance picture. Because of this, TRM is identifying more of the downstream facilitation layer on-chain, making it possible to map the infrastructure that supports laundering at scale.
Escrow and guarantee marketplaces: The settlement backbone of cross-border laundering
Escrow services and Chinese-language “guarantee” marketplaces have become a central settlement layer in cross-border laundering, particularly among Chinese money laundering organizations operating across the Asia-Pacific (APAC) region. These ecosystems reduce counterparty risk by enforcing trust through escrow, reputation systems, and dispute resolution — enabling rapid stablecoin-based value transfer in corridors where speed and reliability often matter more than formal access to banking.
Over time, these services have evolved from niche facilitators into large-scale settlement infrastructure, supporting high-frequency exchange between stablecoins and fiat, even when cash collection and structuring occur primarily off-chain. This shift is visible in the scale of flows routed into Chinese money laundering escrow services, with total inflows rising from a small baseline in 2020 to over USD 103 billion in 2025, expanding more than fourfold since 2022.
From 2024 to 2025, Chinese-language guarantee marketplaces on Telegram matured into one of the most important settlement layers in the APAC cybercrime economy. The market was highly concentrated across major hubs, led by Huione Pay (~USD 73.0 billion), followed by Haowang (~USD 7.3 billion), Xinbi (~USD 5.9 billion), and Tudou (~USD 3.0 billion). Rather than eliminating activity, enforcement actions and platform disruption largely reshaped where settlement occurred, reinforcing the resilience of the underlying escrow model.
Key developments in the market’s evolution included:
- May 2025: FinCEN designated Huione Group a “foreign financial institution of primary money laundering concern” under Section 311
- Shortly after: Telegram removed channels associated with Haowang Guarantee and Xinbi, disrupting two major visible hubs
- Re-routing followed: Vendors and flows displaced toward Tudou, which benefited from Huione’s earlier 30% stake acquisition, with inflows rising to ~USD 70 million per week (May–November 2025)
- Late 2025: After finalization of the Section 311 rule (effective November 17, 2025), Huione Pay inflows fell sharply to ~USD 100 million per month by December 2025, consistent with intensifying de-risking
- Xinbi showed resilience: After removal, it reportedly reappeared under the same Telegram ID and saw a ~90% increase in daily inflows, later promoting migration toward a mirrored escrow service on a proprietary chat platform
These ecosystems remain a key enforcement focus because they concentrate settlement at scale and create monitorable chokepoints. The most durable signals tend to be behavioral rather than brand-based, including broker hubs, repeated counterparty patterns, short holding periods, and consistent off-ramp dependencies.
From “hub” to ecosystem
In 2024, guarantee marketplaces matured into standardized infrastructure, with escrow as the trust mechanism and USDT as the settlement layer. In 2025, enforcement and platform actions stress-tested that infrastructure and the market adapted through migration and rebranding. The result is an ecosystem with multiple viable settlement venues operating in parallel, including growing successor services capable of absorbing displaced activity.
The practical takeaway is that enforcement changes the shape of the market. It can degrade trust, increase transaction friction, reduce access to rails, and force fragmentation. But as long as demand persists, the escrow function will reappear — increasingly across multiple platforms by design, rather than by accident.
Major crypto-enabled money laundering takedowns in 2025
In 2025, law enforcement agencies across the Americas and Europe demonstrated an improved ability to disrupt crypto-enabled money laundering infrastructure. Across 2025’s prominent cases in Brazil, Canada, Spain, Germany, the broader EU, and the US, a consistent pattern emerged: Though criminal actors continue to rely on crypto, they frequently leave sufficient on-chain, operational, and custodial footprints to allow authorities to map networks, attribute infrastructure, and execute large-scale seizures when blockchain intelligence is combined with traditional investigative techniques.
Several of the largest and most effective actions in 2025 targeted infrastructure, not individual transactions.
Brazil: Dismantling industrial-scale laundering networks
Operation Lusocoin, led by the Brazilian Federal Police, targeted a laundering and foreign exchange evasion architecture of exceptional scale. Authorities estimate that the network moved tens of billions of Brazilian reais through a web of shell companies, OTC crypto brokers, and non-custodial wallets. Proceeds were linked to drug trafficking, smuggling, tax evasion, and other serious crimes — with leadership reportedly operating abroad, and operational nodes distributed across multiple Brazilian cities.
The enforcement action froze assets equivalent to hundreds of millions of US dollars, spanning crypto balances, bank accounts, vehicles, and real estate. Stablecoins, including several million USD worth of USDT across dozens of wallets, were a prominent working capital layer within the network. The case shows that large-scale laundromats diversify holdings across fiat, crypto, and real-world assets, and that disruption requires pursuing all of those asset classes in parallel.
Separately, Operation Deep Hunt, led by Goiás State Civil Police, illustrates how crypto has become embedded in what were once considered traditional cyber-fraud and carding schemes. Investigators documented roughly tens of millions of USD laundered through crypto rails following the theft of banking data, cloned cards, and forged identities. Authorities seized a substantial portion of the identified proceeds, again across both on-chain and off-chain assets.
Deep Hunt publicly highlighted cooperation with exchanges and the use of blockchain intelligence to reconstruct transaction graphs, identify key individuals, and bridge pseudonymous wallet activity with named suspects.
Canada: Removing a high-risk offshore exchange
In Canada, the Royal Canadian Mounted Police (RCMP) dismantled TradeOgre, an offshore exchange that had operated for years without registration or meaningful compliance controls. On-chain analysis showed TradeOgre as a hub for funds linked to darknet markets, ransomware, scams, and other high-risk activity — effectively serving as an aggregation and off-ramping point within the illicit crypto ecosystem.
In September 2025, RCMP seized control of exchange-controlled wallets holding tens of millions of USD in digital assets, marking the largest crypto seizure in Canadian history. This deprived criminal users of a trusted venue, locked customer balances, and forced displacement into less familiar and potentially more observable channels.
One key to success was investigators' combination of wallet clustering and flow analysis with seed phrase reconstruction, allowing them to convert recovered physical evidence into complete historical wallet views. This approach illustrates how blockchain intelligence can turn partial artifacts into comprehensive financial records.
Europe and the US: Targeting mixers, swaps, and cash-for-crypto services
Spain and the EU: Cash-to-crypto networks under pressure
A coordinated Spanish and EU-wide operation targeted an underground cash-to-crypto network serving primarily Russian-speaking and Asian organized crime clients. The service allowed customers to hand over large volumes of physical cash and receive stablecoins (often USDT) delivered to wallets or exchange accounts under various forms of obfuscation.
Enforcement actions led to dozens of arrests and the seizure of more than EUR 30 million in cash, crypto, and bank funds. Authorities froze tens of millions of USD in USDT, demonstrating the growing ability of authorities to act quickly against stablecoin balances.
While public disclosures focused on arrest figures and asset totals, the case aligns closely with broader European use of real-time monitoring and rapid-freeze workflows for TRON-based stablecoins, combined with conventional surveillance and cross-border cooperation.
Germany and the EU: Dismantling mixers and swap services
The Cryptomixer takedown removed one of the longest-running bitcoin mixing services, which had processed billions of EUR in BTC since at least 2016. German and Swiss authorities seized backend servers and confiscated tens of millions of EUR in crypto. More importantly, they secured approximately 12 terabytes of internal data — including logs, wallet mappings, and transaction records — which is expected to support years of follow-on investigations.
Similarly, German authorities dismantled eXch.cx, an anonymous crypto-to-crypto swapping service advertised explicitly as having no KYC or AML controls. Over its lifetime, the service processed billions of USD in crypto, with exposure to darknet markets, payment card crime, major hacks, and child sexual abuse material-related payments. The seizure removed a high-throughput laundering node just as it attempted to shut down voluntarily.
United States: Covert operations against cash-for-crypto services
In the US, the case against the dark-web cash-for-crypto service operated by Anurag Pramod Murarka illustrates a different enforcement approach. US authorities did not immediately shut down the network after the initial arrest, but instead covertly ran the service for an extended period of time. This allowed investigators to map customer networks across darknet markets, hacking communities, and other criminal ecosystems — collecting evidence under controlled conditions.
Blockchain analysis played a central role in demonstrating that the service pooled and mixed funds from multiple criminal sources, rather than merely facilitating one-off swaps. On-chain mapping was fused with communications data, travel records, and cloud forensics to link wallet clusters to real-world identities. The result was a lengthy prison sentence and the seizure of cash and digital evidence that will likely support additional investigations.
{{premium-content_chapter-divider}}
Terrorism
<h3 class="premium-content_subhead">ISIS crypto use mirrored broader upward adoption trend, led by Islamic State Khorasan Province (ISKP)</h3>
ISKP remains the ISIS affiliate most synonymous with cryptocurrency use. Over the last few years, TRM has identified dozens of addresses controlled by the group, totaling hundreds of thousands of dollars. These addresses — which were almost exclusively USDT on TRX — conducted hundreds of transactions ranging between USD 100 to USD 15,000. These transactions have moved through regulated exchanges, high-risk exchanges, and individual cryptocurrency traders — some of whom are witting to ISKP’s activities. ISKP has used funds to solicit donations, move funds between affiliates, and fund attacks.
The spring joint Pakistani-Turkish arrest of Ozgur Altun, a key figure in the group’s finance and media functions, was a notable disruption to ISKP’s cryptocurrency use. Following his arrest, TRM data showed a decline in ISKP activity — although it has since rebounded, aided in part by the growing role of ISKP’s regional affiliates. ISKP increased its use of swapping services, in a likely attempt to improve operational security to include cross-chain swap obfuscation and low-to-no KYC services.
In another sign of growth, TRM has identified several other ISKP-linked fundraising campaigns and media units in multiple countries over the last 12 months, all of which were connected on the blockchain.
ISIS affiliates solicited crypto donations, primarily for displaced ISIS members and families in Syria
In Syria, the fundraising campaigns for ISIS members and families held in displacement camps remain a driver of cryptocurrency use by the group’s supporters around the world. While the dozens of campaigns identified by TRM focus on the humanitarian aspect, ISIS as an organization benefits from these campaigns, with some linked to terror attacks. The majority of cryptocurrency terrorism convictions around the world in the last 12 months, including in the United States, were linked to these campaigns.
TRM has observed other Syria-based fundraising efforts, including one for ISIS fighters in Syria, although it also facilitates the transfer of funds to ISIS affiliates, including ISKP and ISWAP.
African ISIS affiliates used crypto for fundraising, weapons purchases
In Africa, there is evidence of the growing role of cryptocurrency for ISIS affiliates, particularly in Nigeria and Somalia. In Nigeria, cryptocurrency was used in fundraising campaigns by ISIS-linked groups in Nigeria, including to purchase weapons and drones. More recently, a media unit linked to Islamic State West Africa Province (ISWAP) began publicly soliciting donations in bitcoin.
TRM data indicates that addresses linked to ISIS activity in Nigeria is primarily USDT on TRX, with hundreds of thousands of dollars of volume identified. ISIS’s affiliate in Somalia, the key financial hub for ISIS in Africa, has repeatedly turned to cryptocurrency to move funds across borders and fund activities, with a recent TRM-supported conviction in Sweden, providing further evidence.
Iranian proxies — Hamas, Hezbollah, and the Houthis — maintained access to cryptocurrency, despite increased targeted enforcement actions
Hamas
US and Israeli authorities intensely pursued Hamas’ use of cryptocurrency in 2025.
The US DOJ announced the seizure of approximately USD 200,000 in cryptocurrency tied to a Hamas financing scheme in March. The seized cryptocurrency was associated with a broader network of wallets that had facilitated more than USD 1.5 million in transactions in support of Hamas, according to US authorities.
In July, the DOJ unsealed a civil forfeiture action targeting roughly USD 2 million in cryptocurrency connected to Buy Cash Money and Money Transfer Company (BuyCash), a Gaza-based financial facilitator previously sanctioned for providing material support to Hamas and other terrorist groups. The forfeiture seized digital assets held at major cryptocurrency platforms, and highlighted the US government’s focus on intermediaries that enable terrorist financing, not just the end beneficiaries. US officials framed the case as part of a broader strategy to dismantle financial infrastructure supporting Hamas, including crypto-enabled money service businesses.
Israel’s National Bureau for Counter Terror Financing (NBCTF) continued its own crypto-focused enforcement activity in 2025. The NBCTF issued multiple seizure orders targeting dozens of wallets assessed to be linked to Hamas, with a total volume of over USD 350 million.
Houthis and Hezbollah
The Houthis (aka Ansarullah) used cryptocurrency as part of broader sanctions evasion and financing efforts in 2025, despite their designation under US terrorism and sanctions programs. In 2025, OFAC sanctioned eight crypto wallet addresses linked to the Houthis. TRM Labs’ analysis shows these wallets collectively facilitated over USD 1.8 billion in total volume, including transfers to high-risk and sanctioned counterparties.
Notably, some of these transactions linked to the Houthis were used to support procurement networks — including payments to intermediaries associated with the acquisition of UAVs, anti-UAV equipment, and other military-related goods. Some of these funds moved through brokers and facilitators connected to Russia, Iran, and Hezbollah-linked networks, highlighting crypto’s role in cross-border payments outside the traditional financial system.
{{premium-content_chapter-divider}}
Conclusion
Illicit crypto activity reached its highest recorded level in 2025, but the broader context tells a more nuanced story. As adoption deepens, illicit activity now operates within a larger, more mature ecosystem. Illicit actors absorbed a smaller share of capital entering the crypto economy than in previous years, showing a downward trend in relative risk.
This year was driven primarily by improved attribution and a concentration of large scale events, most notably the emergence of A7A5 and other Russia-linked entities as high volume, sanctions designated actors. These flows reflect more than just evasion; they point to the institutionalization of crypto rails by state-aligned actors seeking durable alternatives to traditional infrastructure — in effect, using crypto as one tool in the toolkit to build a shadow economy operating in parallel to the legitimate economy.
TRM’s updated methodology, including its liquidity-based metric and lower bound denominator, captures this shift. It offers a realistic lens through which to consider how illicit actors interact with the crypto economy, and a clearer baseline for measuring economic impact. While detection has improved, the scale and ambition of the networks involved underscore the need for continued investment in cross-sector coordination, precision attribution, and crypto native enforcement tools.
Crypto is no longer novel — for threat actors or the institutions and individuals tasked with countering them.
{{premium-content_chapter-divider}}
About TRM Labs
TRM Labs provides blockchain analytics solutions to help law enforcement and national security agencies, financial institutions, and cryptocurrency businesses detect, investigate, and disrupt crypto-related fraud and financial crime. TRM’s blockchain intelligence platform includes solutions to trace the source and destination of funds, identify illicit activity, build cases, and construct an operating picture of threats. TRM is trusted by leading agencies and businesses worldwide who rely on TRM to enable a safer, more secure crypto ecosystem.
TRM is based in San Francisco, CA, and is hiring across engineering, product, sales, and data science. To learn more, visit www.trmlabs.com.


.svg)

.png)


