How Prediction Markets Scaled to USD 21B in Monthly Volume in 2026

Key takeaways
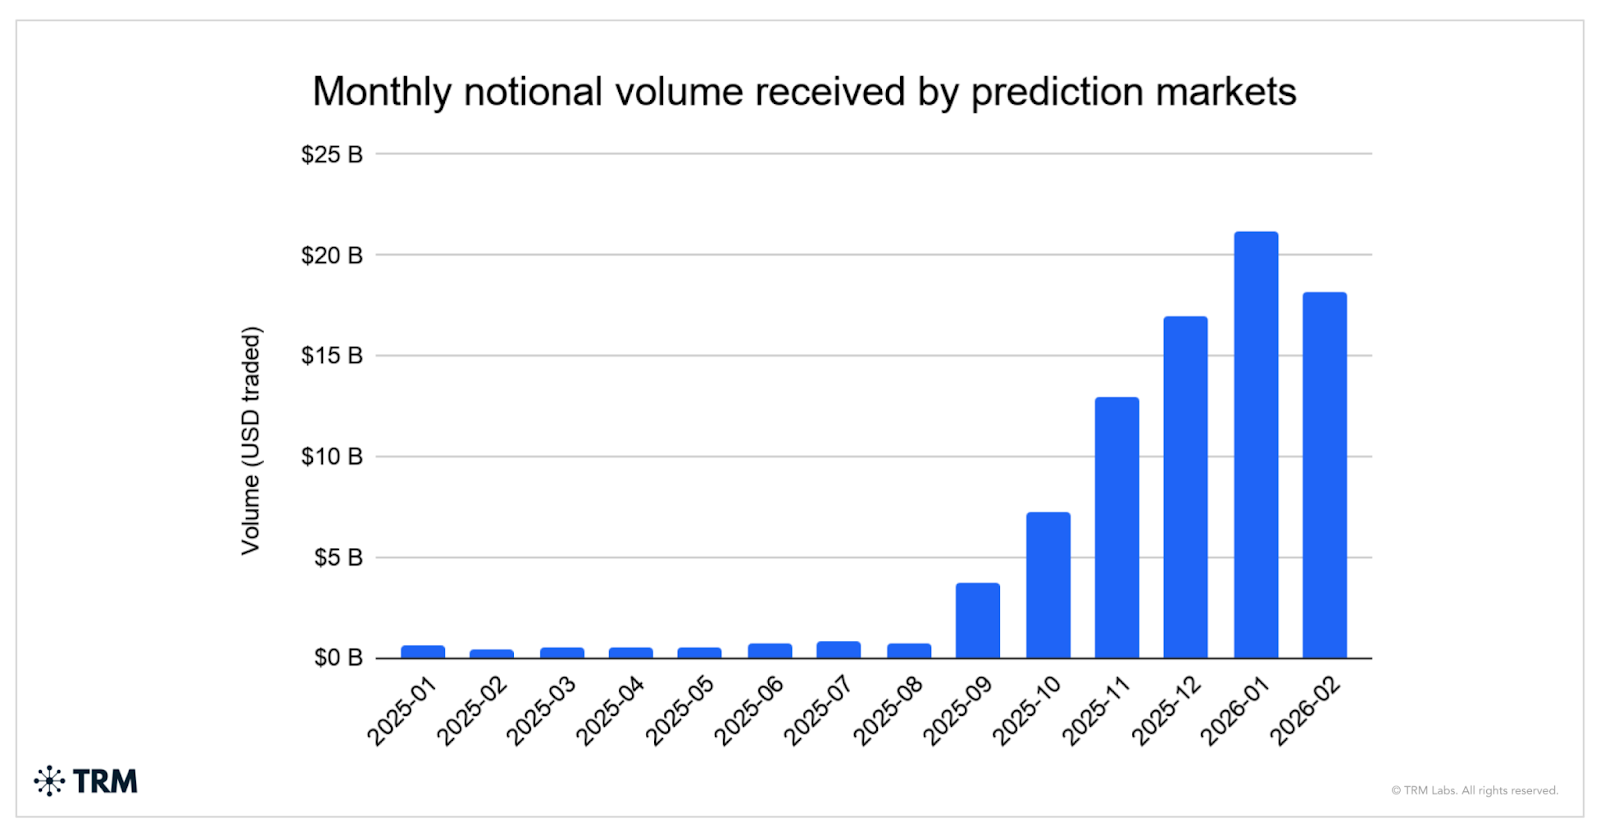
- Prediction markets are now a major global financial market. Monthly transaction volume across prediction markets grew from USD 1.2 billion in early 2025 to over USD 20 billion in January 2026, with more than 800,000 unique wallets participating each month.
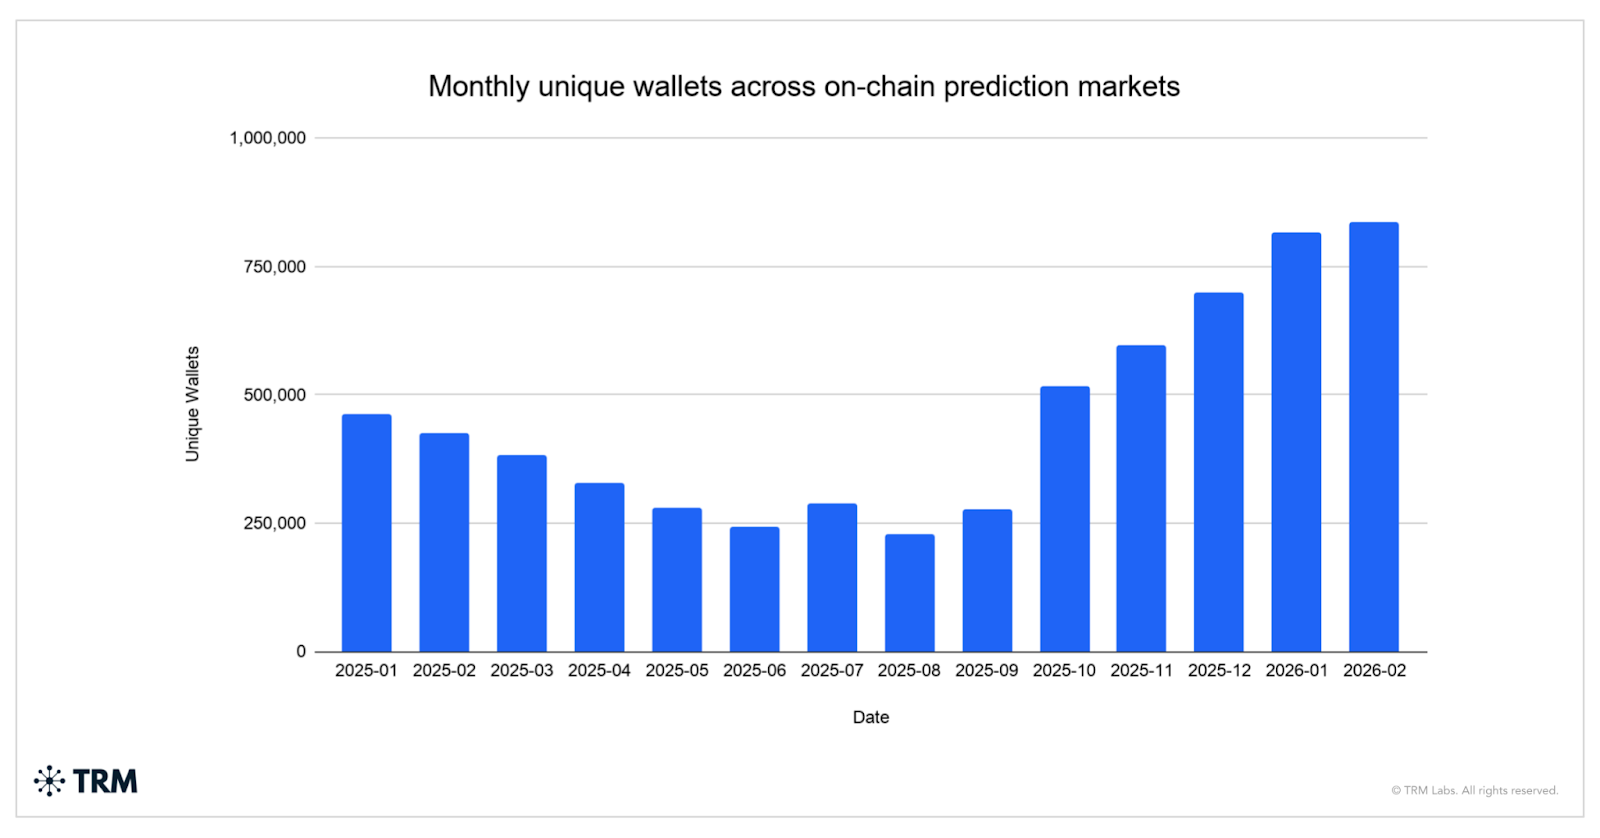
- The surge in activity was not solely driven by existing users increasing their trading volumes, but by a rapidly expanding user base, with unique wallets more than tripling to 840,000 in the six months leading up to February 2026.
- The types of bets people make of these platforms varies widely. Geopolitics, macroeconomics, and politics — not crypto — now drive the majority of trading activity, positioning prediction markets as real-time indicators of global events.
- User activity can be clearly segmented on-chain by trading patterns — mid-frequency traders (11–1,000 trades) are the most active cohort, followed by high-frequency market makers (>10,000 trades), while new entrants contribute a small but still important share of participation.
- TRM’s analysis of on-chain trading patterns identified clusters of potentially coordinated activity that coincided with major geopolitical events, including the recent US airstrikes against Iran – behavior that could support suspicions of market manipulation. While there is currently no clearly established legal treatment of these trading patterns on prediction markets today, recent legislative proposals in the United States call for explicit bans on insider trading in prediction markets, underscoring how observed market activity is beginning to shape emerging policy frameworks.
- On March 23, 2026, both Kalshi and Polymarket publicly outlined new measures to curb insider trading, emphasizing restrictions on participants with potential access to non-public information and enhanced market integrity controls. These efforts are, in part, enabled by the inherent transparency of blockchain-based markets, where trading activity can be openly observed and analyzed.
{{horizontal-line}}
From little-known niche to multi-billion dollar market
Prediction markets are platforms where users trade on the outcome of future events — from elections and economic indicators to sports and cultural moments — by buying and selling event contracts that pay out based on what actually happens. Historically, these markets have existed on the margins of both finance and forecasting, from early platforms like Intrade and Augur to more recent blockchain-based systems that enable global, real-time participation. Prediction markets use crypto rails to reap benefits from low transaction costs, composability, accessibility, and continuous liquidity.
Over the past year, activity in these markets dramatically accelerated. Monthly trading volume, which hovered around USD 1.2 billion in 2025, began to accelerate sharply in September 2025, entering a new regime of sustained double-digit billions. By early 2026, volumes exceeded USD 20 billion per month.
The number of users likely grew during this time, as well. TRM approximated users by looking at the distinct number of wallets interacting with Polymarket, LIMITLESS, Opinion Market, and predict.fun. Monthly unique wallets nearly tripled in the six months leading up to February 2026, reaching 840,000. This indicates that growth is driven not just by larger bets from existing users, but by a broad expansion of the participant base.
Today, if you log onto Polymarket, you will find the top open markets all have to do with geopolitical bets related to the US, Iran and Israel. USD 63 million has been sent to the market: “Will Israel launch a major ground offensive in Lebanon by March 31?”
From crypto hype to geopolitical bets
The rapid rise of prediction markets can be traced back to October 2024. A US court ruled that Kalshi could legally offer election contracts, and the platform relaunched within hours — 32 days before the presidential election. The blanket press coverage that followed gave prediction markets their proof-of-concept moment.
In January 2025, Kalshi launched sports event contracts in all 50 states. A March 2025 partnership with Kalshi brought Robinhood’s prediction markets hub to its 27 million funded brokerage accounts, exposing them to prediction markets for the first time; Super Bowl related volumes on these prediction markets alone exceeded USD 1 billion. By January 2026, a new CFTC chairman withdrew proposed rules restricting prediction markets and Polymarket received a no-action letter from the CFTC, reducing enforcement risk and paving the way for its re-entry into the US market. In October 2025, ICE/NYSE — parent of the New York Stock Exchange — announced a strategic investment of up to $2 billion in Polymarket at a USD 8 billion valuation, the clearest institutional legitimacy signal yet. While there have also been major regulatory headwinds, such as Nevada gaming regulators suing Kalshi in Feb 2026 and the Arizona AG filing lawsuits against Kalshi in March 2026, the markets have still experienced explosive growth.
To understand the mechanics of what drove this surge, TRM examined Polymarket data from October 2025 – the month after the explosive growth began – to see which markets were most active and driving this activity. TRM identified a surge in activity that coincided with strong engagement across major prediction markets, particularly in finance and politics.
Markets related to the New York City Election drew the most engagement in October 2025, receiving over USD 150 million in volume. The most active market in this group was “Will Zohran Mamdani win the 2025 NYC mayoral election?”. This market drew 34,415 unique wallets and generated $99.0M in volume. The next most popular type of bet was around the Super Bowl, attracting over USD 88 million in value across 10 different outcomes. Macro-driven bets also saw significant participation, including “Fed decreases interest rates by 25 bps after October 2025 meeting?”, alongside rate hike and no-change scenarios collectively attracting tens of thousands of users. Crypto markets remained a key driver of user interest, with markets speculating on Bitcoin prices receiving over USD 50 million in volume.
Table 1: Top ten markets by volume on Polymarket, October 2025
When crypto price momentum cooled, geopolitics took over as the driver. Volumes on Polymarket diversified into tariffs (116 active markets), Ukraine ceasefire scenarios, and China-Taiwan tensions. A single market — "Will the US strike Iran by Feb 28, 2026?" — attracted USD 73 million in February 2026, the largest geopolitical contract in Polymarket’s history. Meanwhile, a distribution flywheel locked in: Google Finance began embedding live Polymarket and Kalshi odds. Prediction market prices started appearing in mainstream news coverage, driving users back to the platforms — a cycle amplified when Polymarket’s CEO appeared on 60 Minutes.
Table 2: Top five markets by volume on Polymarket, February 2026
By February 28, 2026, Polymarket set a new, single-day volume record of USD 425 million — surpassing the prior high from Election Day 2024. The single-day record was driven almost entirely by Iran-related markets resolving simultaneously. The “Khamenei out as Supreme Leader of Iran by February 28” market surged from USD 23,000 in volume on February 27 to USD 29.6 million on February 28 — a 1,275x increase in a single day, the largest day-over-day spike ever recorded on the platform. Both sides of the market moved: the YES token jumped 1,275x while the NO token grew 10.5x, with the full market going from USD 930,000 to USD 39 million in 24 hours. Traders simultaneously rushed into longer-dated Iran contracts: the “Khamenei out by March 31” market spiked 78x to USD 13 million as participants began pricing in an extended timeline for regime change.
These user dynamics highlight four defining features of the Polymarket market structure:
- First, geopolitics dominates at the top end, but not in a single theme. Instead, volume fragments across a wide range of overlapping questions: leadership outcomes (Khamenei, Xi, Netanyahu), conflict scenarios (Iran, Ukraine, Venezuela), and policy events (US government shutdowns). Rather than one dominant narrative, the market continuously reprices multiple parallel geopolitical risks. This aligns with broader activity on the platform, where geopolitical events routinely drive the largest spikes in trading volume.
- Second, US politics remains a core secondary pillar. Contracts tied to domestic political events — from government shutdowns to document releases — consistently rank among the highest-volume markets. These events combine high information flow with clear resolution criteria, making them structurally similar to geopolitical bets.
- Third, the market does not separate “serious” from “non-serious” events. Alongside war, elections, and macroeconomic questions, high-volume contracts include entertainment and cultural moments: whether a fictional character will die, whether a public figure will say a specific word, or whether a niche crypto asset will reach a valuation threshold.
- Fourth, prediction markets do not separate event contracts by instrument classification (commodity, security, wager), creating a “super app” like experience for users to trade multiple instruments on one platform.
User segmentation in prediction markets: activity, market choice, and profit outcomes
TRM used Polymarket on-chain data to understand what types of users are most active on the top 500 markets in 2026. To do this, we analyzed maker addresses — the wallets that post limit orders on Polymarket’s order book — which serve as the most reliable on-chain identifier for individual participants. The data reveals a clear stratification by experience:
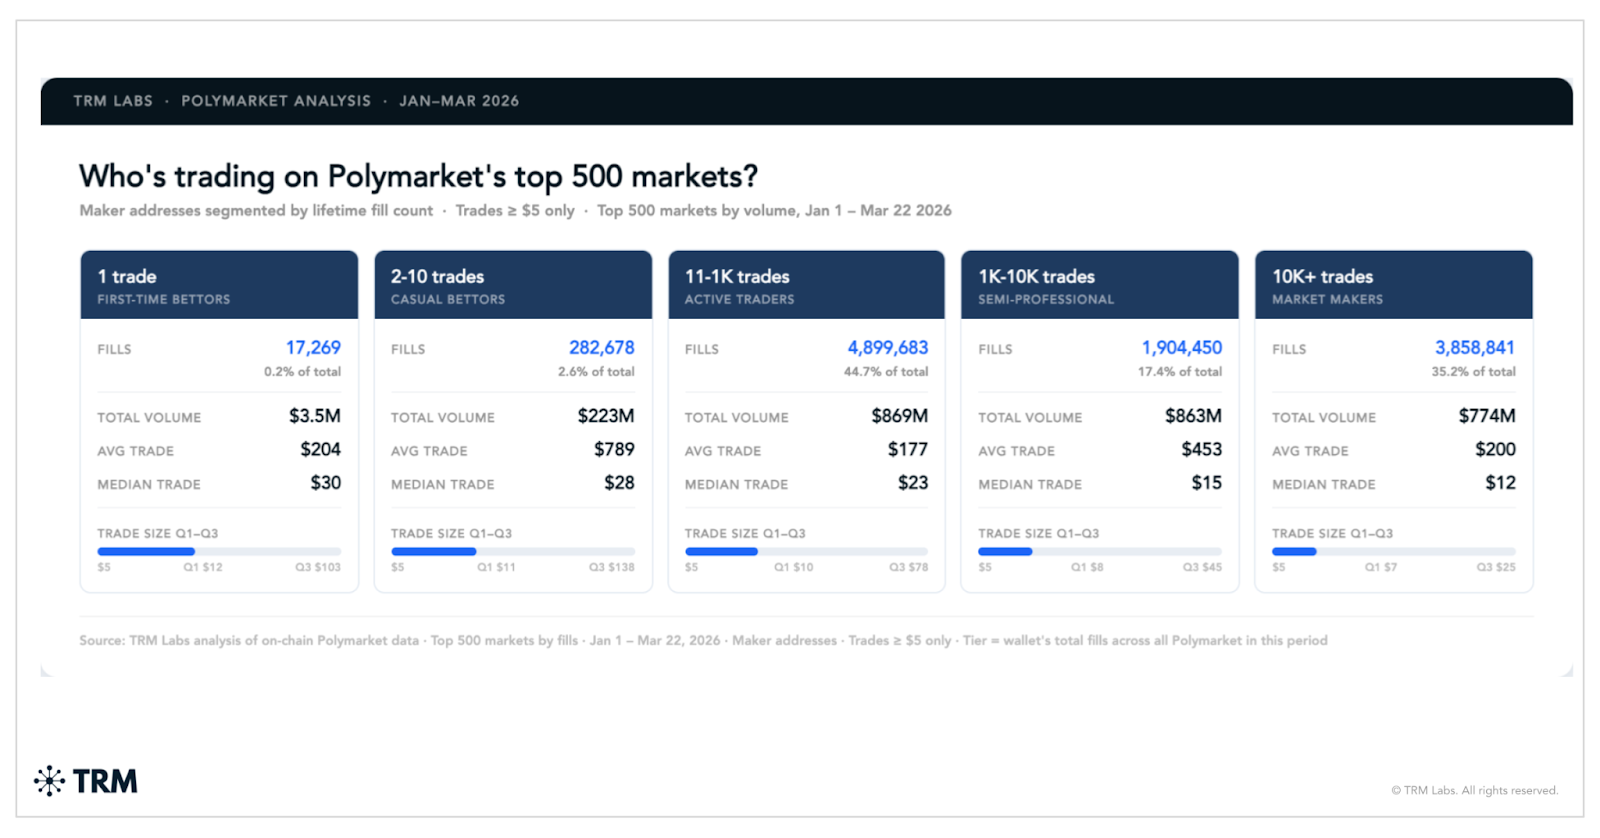
Wallets with between 11 and 1,000 lifetime fills are the most active cohort, accounting for 44.7% of all trades and USD 869M in volume. Wallets with over 10,000 fills — consistent with algorithmic market makers posting continuous buy and sell orders rather than taking directional positions — account for 35.2% of trades and USD 774M in volume. Casual bettors who placed just a single trade represent less than 0.2% of activity and only USD 3.5M in volume. The median trade size tells a similar story: first-time bettors placed median bets of USD 30, while the most active wallets placed a median of just USD 12 per trade, suggesting that high-frequency participants are executing many small trades to capture spreads rather than making large conviction bets on outcomes.
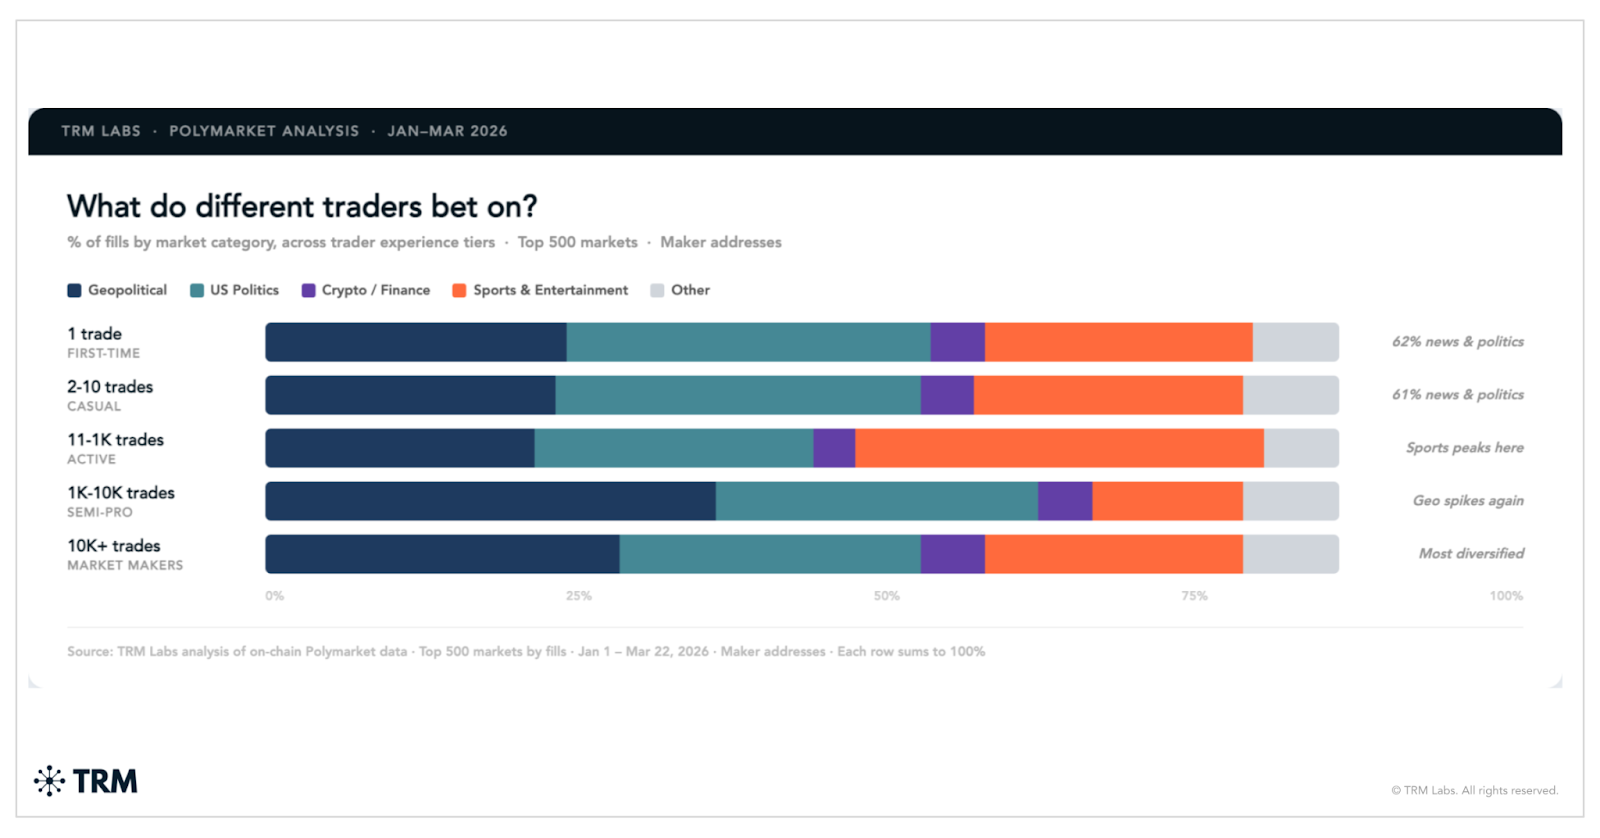
Looking at what tiers have in common, across every experience level, from single bettors to algorithmic traders, geopolitical and US political markets account for the majority of activity. A first-time bettor and a professional market maker are both, predominantly, betting on the news. Crypto price markets, despite being native to the same blockchain infrastructure, represent a consistently small share of activity at every tier. Sports and entertainment betting, often assumed to be the domain of casual users, actually peaks among mid-tier active traders and the most experienced market makers, not among newcomers.
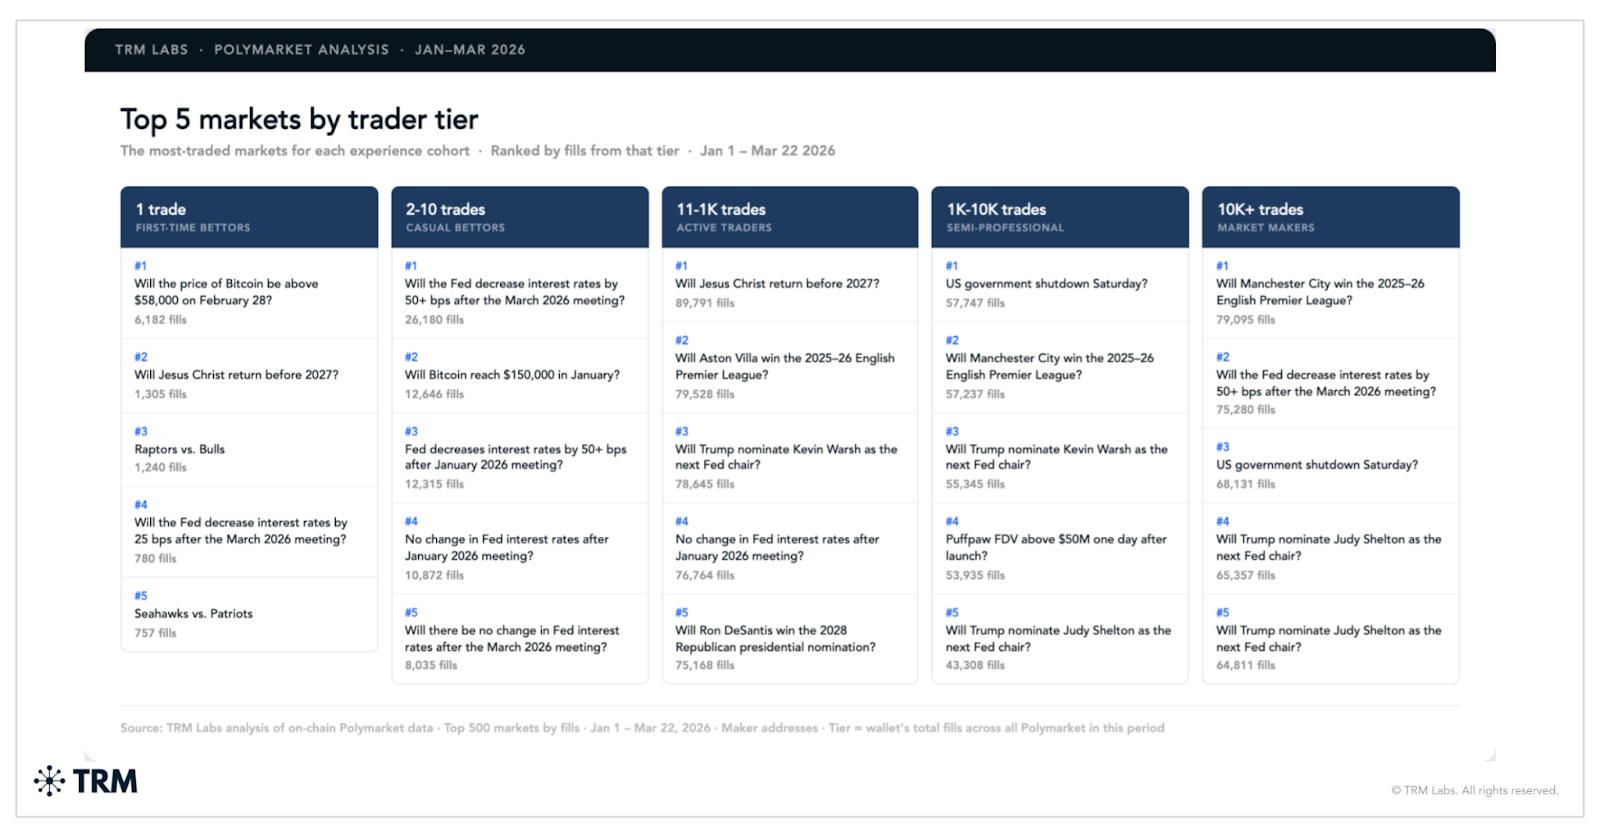
The five most-traded markets for each tier, shown below, illustrate these patterns:
Wallet-level data sharpens this picture further; we can also analyze wallet profitability. The 10 most profitable Polymarket wallets in early 2026, shown below, reflect three main strategies. First, macro conviction: wallets #3 and #4 focused heavily on US Federal Reserve (Fed) rate decisions, with #3 earning USD 3.26M by selling both “hike” and “cut” tokens ahead of a hold. Second, algorithmic market-making: wallet #2 made USD 3.35M across 1M+ small trades in Oscars markets, while wallet #9 generated USD 664K steadily across NBA games. Third, event-driven opportunism: wallet #8 appeared for a single day, timed Ethereum price swings, made USD 709K, and exited.
Most top wallets weren’t specialists — wallet #1 led with USD 6.2M across diverse markets (Fed, World Cup, 2028 election).
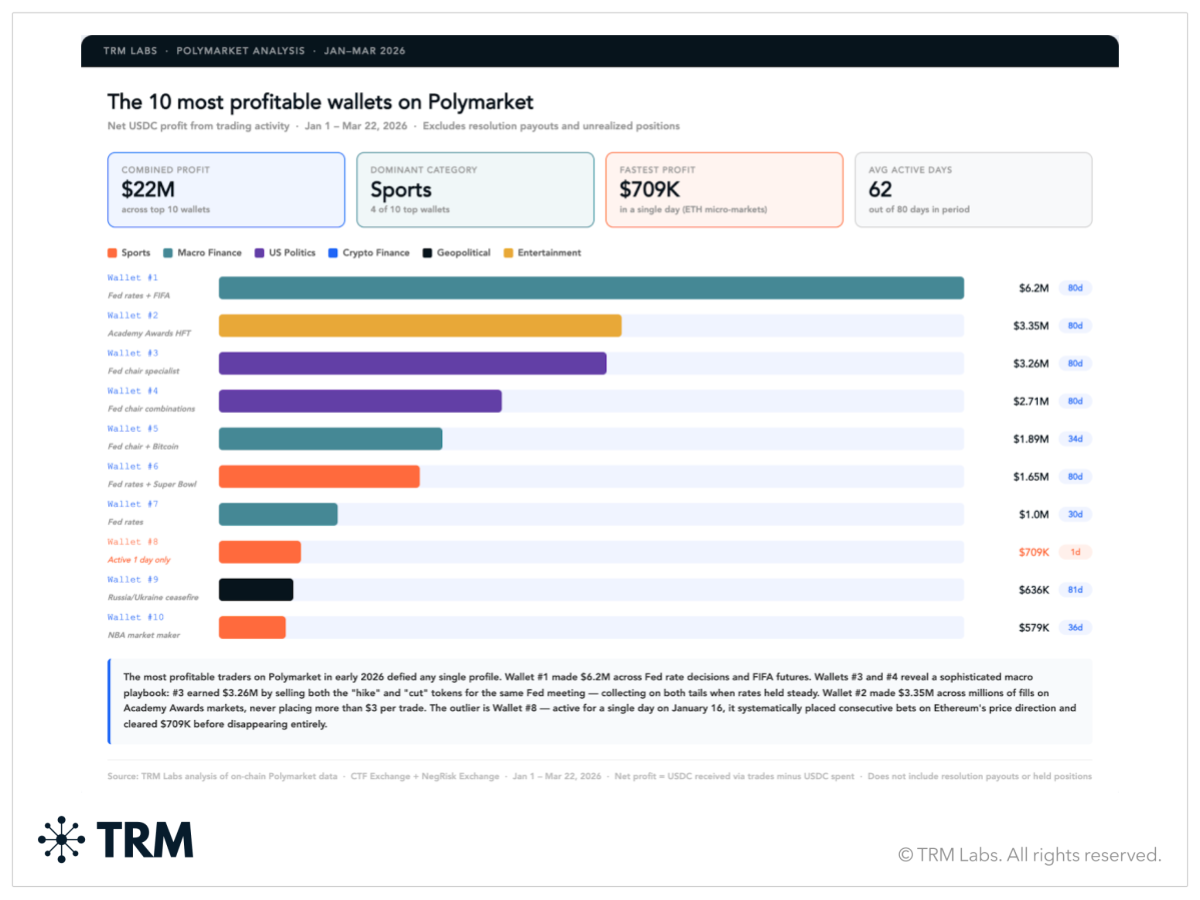
Activity levels varied, but consistency was common. Six of the ten wallets traded every day over the 80-day period, two were active on 54 days, and one focused on just 30 event-driven days. Active days refer to distinct calendar days with at least one trade, meaning several wallets were truly active daily from January 1 to March 22, 2026. What unified them wasn’t focus, but the ability to spot mispriced probabilities across markets.
Market structure, legal ambiguity, and emerging manipulation patterns
Most participants engage with prediction markets as intended, but TRM analysts have observed behaviors that resemble forms of market manipulation as defined in traditional finance: coordinated wallets entering positions ahead of major news, accounts funding once to place a single high-conviction bet and exiting immediately after resolution, or thin markets where a single participant dominates pricing.
In traditional financial markets, these behaviors are addressed by well-established legal frameworks. The Commodity Exchange Act bars wash trading and coordinated price manipulation. Securities law governs insider trading through fiduciary duty and the concept of material non-public information. These frameworks rest on clear regulatory authority, defined market structure, and enforceable disclosure obligations — legal architecture built for markets with identifiable participants, disclosed positions, and accountable intermediaries.
As prediction market volumes approach those of established derivatives markets, regulatory attention is accelerating. These markets now sit in a structural grey zone — and the patterns documented below illustrate what the combination of transparency, pseudonymity, and legal ambiguity produces in practice.
Transaction patterns and market manipulation
“Insider trading” in the context of prediction markets is more of a colloquial description than a clearly defined legal concept. It is generally used to describe situations where a participant places bets based on non-public information about a real-world outcome before that information is reflected in market prices. This can include scenarios where a person misappropriates confidential information in breach of a duty of trust and confidence, or where a participant trades on an outcome they may have the ability to influence. The latter, in regulated markets, may fall under frameworks such as CFTC Core Principle 3, which requires that contracts not be readily susceptible to manipulation.
Unlike traditional securities markets, however, some prediction platforms do not operate under a legal framework that explicitly prohibits this type of activity. Platforms including Kalshi and Polymarket have recently introduced rules and surveillance measures aimed at curbing trading based on non-public information, reflecting growing scrutiny from regulators and lawmakers.
While the regulatory treatment of information asymmetry in prediction markets is still evolving, on-chain settlement can nonetheless reveal patterns consistent with participants acting on informational advantages – even if those patterns do not neatly map onto established legal definitions of insider trading.
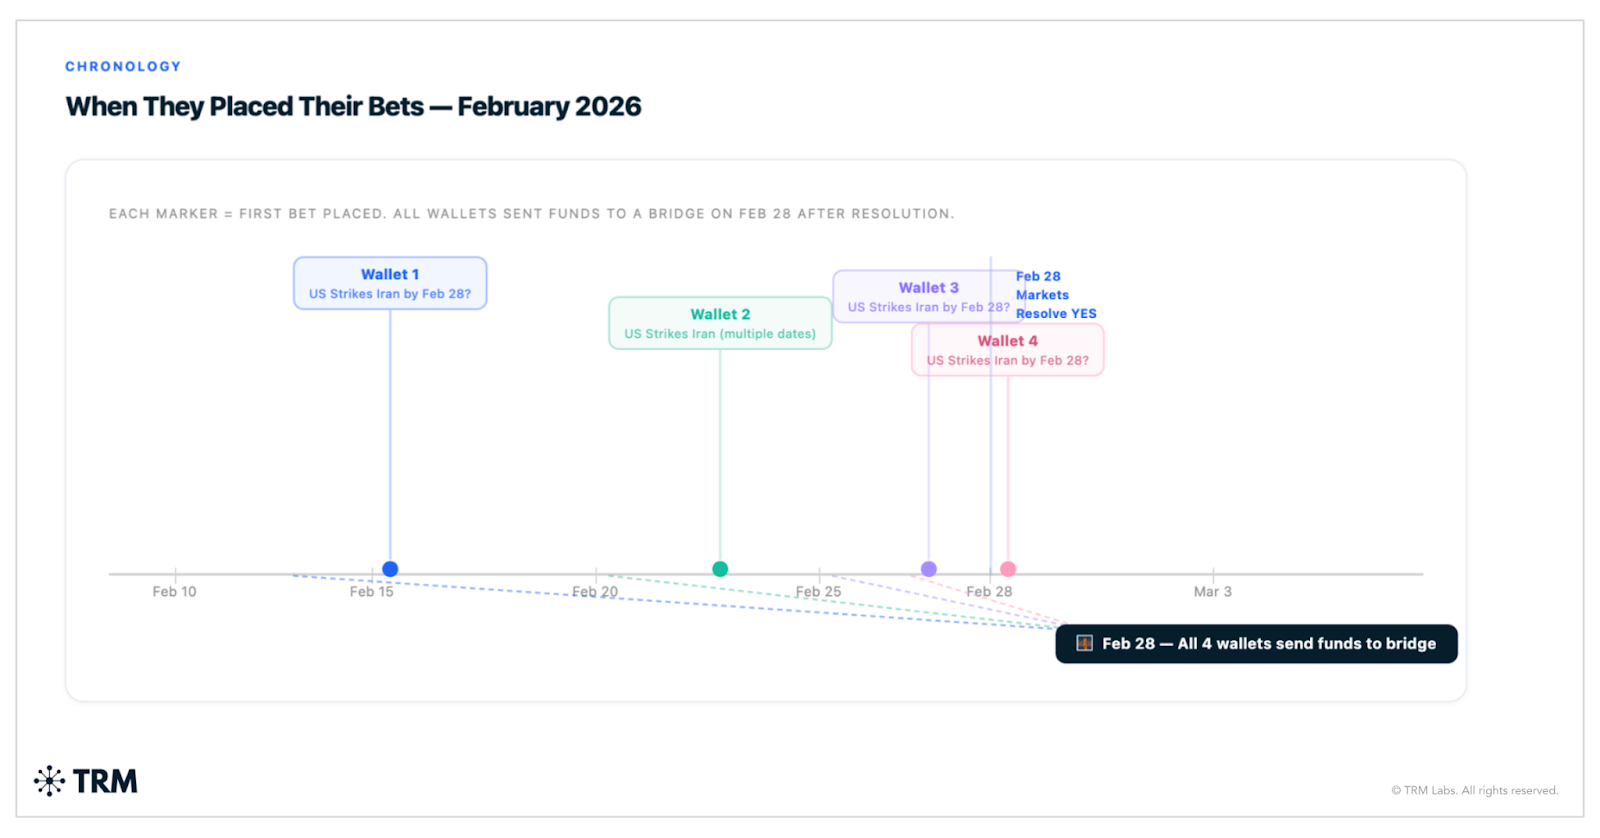
One example of analyzing patterns and timing to look for potentially suspicious activity comes from bets made surrounding the US airstrikes against Iran on February 28, 2026. In this example, TRM identified four wallets that collectively turned roughly USD 40k into USD 872k betting on US military action against Iran in January and February 2026. All four entered markets priced between USD 0.10 and USD 0.80 per share — implying 10–80% probability — and redeemed at USD 1.00 when the market resolved. These four wallets had largely never traded before and then came in at similar times to place a bet when the US would strike Iran.
TRM also observed shared infrastructure between these wallets. All four wallets funded their positions through the same bridge within a narrow time window. After collecting their winnings, all four swept their balances and have not re-entered the market. The synchronized wallet creation, shared funding source, identical exit behaviour, and concentration in a single geopolitical thesis raise questions about potential coordination or shared information.
These findings do not prove insider trading, but they show that on-chain data can surface anomalies that warrant further investigation.
Conclusion
In just over a year, prediction markets have grown from a niche crypto experiment to a USD 20 billion per month financial ecosystem, driven by an expanding user base and a growing range of markets spanning politics, macroeconomics, geopolitics, and culture.
Looking ahead, prediction markets have the potential to evolve beyond speculative platforms into core infrastructure for real-time information aggregation and risk pricing. As liquidity deepens and participation broadens, these markets could increasingly serve as forward-looking indicators for policy decisions, geopolitical developments, and macroeconomic trends—complementing, and in some cases competing with, traditional forecasting tools.
At the same time, their continued growth will depend on how key challenges are addressed. Questions around market integrity, susceptibility to manipulation, and the role of non-public information remain unresolved. Regulatory frameworks are still emerging, while platform-level safeguards are evolving alongside market expansion.
As platforms move to introduce stronger guardrails — highlighted by March 23rd announcements from both Polymarket and Kalshi — analyzing trading patterns is becoming increasingly important. Blockchain data enables the development of heuristics to identify anomalous behavior, flag potentially suspicious wallets, and support more targeted investigation.
Ultimately, the same transparency that enables these markets to function at global scale may also provide the foundation for more effective oversight as the ecosystem matures.
Data methodology
TRM Labs’s analysis is based on raw on-chain event data ingested into our proprietary blockchain data infrastructure. All volume and wallet figures were computed directly from smart contract logs; no third-party data provider or aggregator was used.
Volume calculation
Notional trading volume is computed as the sum of collateral tokens transferred in each fill — counting both the maker side and the taker side independently (i.e., not dividing by two). This methodology matches Polymarket's own publicly reported volume figures and those reported by Dune Analytics dashboards. For Polymarket, collateral is USDC (6 decimal places); for predict.fun and Opinion Markets, collateral is USDT (18 decimal places). The collateral side of each fill is identified by checking which asset ID field is zero (the zero address indicates the collateral token rather than a conditional outcome token).
Wallet segmentation
Wallets were segmented into five tiers based on their total fill count within the analysis period (January 1 – March 22, 2026) across the top 500 markets by volume. Only maker addresses were counted; only trades of $5 or more in collateral value were included. The five tiers are: first-time (1 fill), casual (2–10 fills), active (11–1,000 fills), semi-professional (1,000–10,000 fills), and market maker (10,000+ fills).
Profit and loss
Net profit for individual wallets is calculated as total USDC received via trades minus total USDC spent via trades, within the analysis window. This figure excludes payouts received directly from the Conditional Token Framework resolution contract (i.e., winnings from markets that resolved in a wallet's favour) and does not reflect the value of any outstanding positions held at the end of the period. As a result, P&L figures represent realised trading profit only.
Market identification
Individual outcome tokens were matched to market questions using the Polymarket Gamma API (gamma-api.polymarket.com). Token IDs (stored as hexadecimal values in on-chain logs) were converted to decimal and queried against the API to retrieve the associated market question text. Where multiple tokens resolved to the same question (e.g., YES and NO tokens for the same market), volume and fill counts were summed and reported as a single market.
Analysis period
Unless otherwise stated, all figures cover January 1 – March 22, 2026. Monthly breakdowns use UTC midnight as the boundary. March 2026 figures are partial and will increase as the month progresses.
{{horizontal-line}}
Frequently asked questions
1. What are prediction markets?
Prediction markets are platforms where users trade contracts on the outcome of future events. Prices reflect the market’s implied probability of those events occurring.
2. Why are prediction markets gaining traction now?
Prediction markets have scaled rapidly due to improved accessibility, regulatory developments, and integration with mainstream platforms. They are increasingly used as real-time indicators of geopolitical and macroeconomic events.
3. What types of events drive the most activity?
Geopolitical events, US politics, and macroeconomic decisions account for the majority of trading volume. Crypto-native topics, while prevalent, now represent a smaller share of overall activity.
4. How do prediction markets price events?
Market prices update continuously based on trading activity. These prices can be interpreted as the collective probability assigned to a given outcome by market participants.
5 .Are prediction markets vulnerable to manipulation?
Certain behaviors — such as coordinated trading, concentrated positions in thin markets, or trading ahead of major events — can resemble forms of market manipulation. These patterns are an area of increasing scrutiny.
6. How does blockchain transparency impact these markets?
On-chain data allows trading activity to be observed in real time, enabling analysis of wallet behavior, fund flows, and market dynamics. This transparency supports detection of anomalous or potentially coordinated activity.