2026 Crypto Crime Report Key Insights: TRM Identifies Record USD 158 Billion in Illicit Crypto Flows in 2025, Reversing a Multi-year Decline

This blog features key highlights from TRM’s 2026 Crypto Crime Report.
Key takeaways
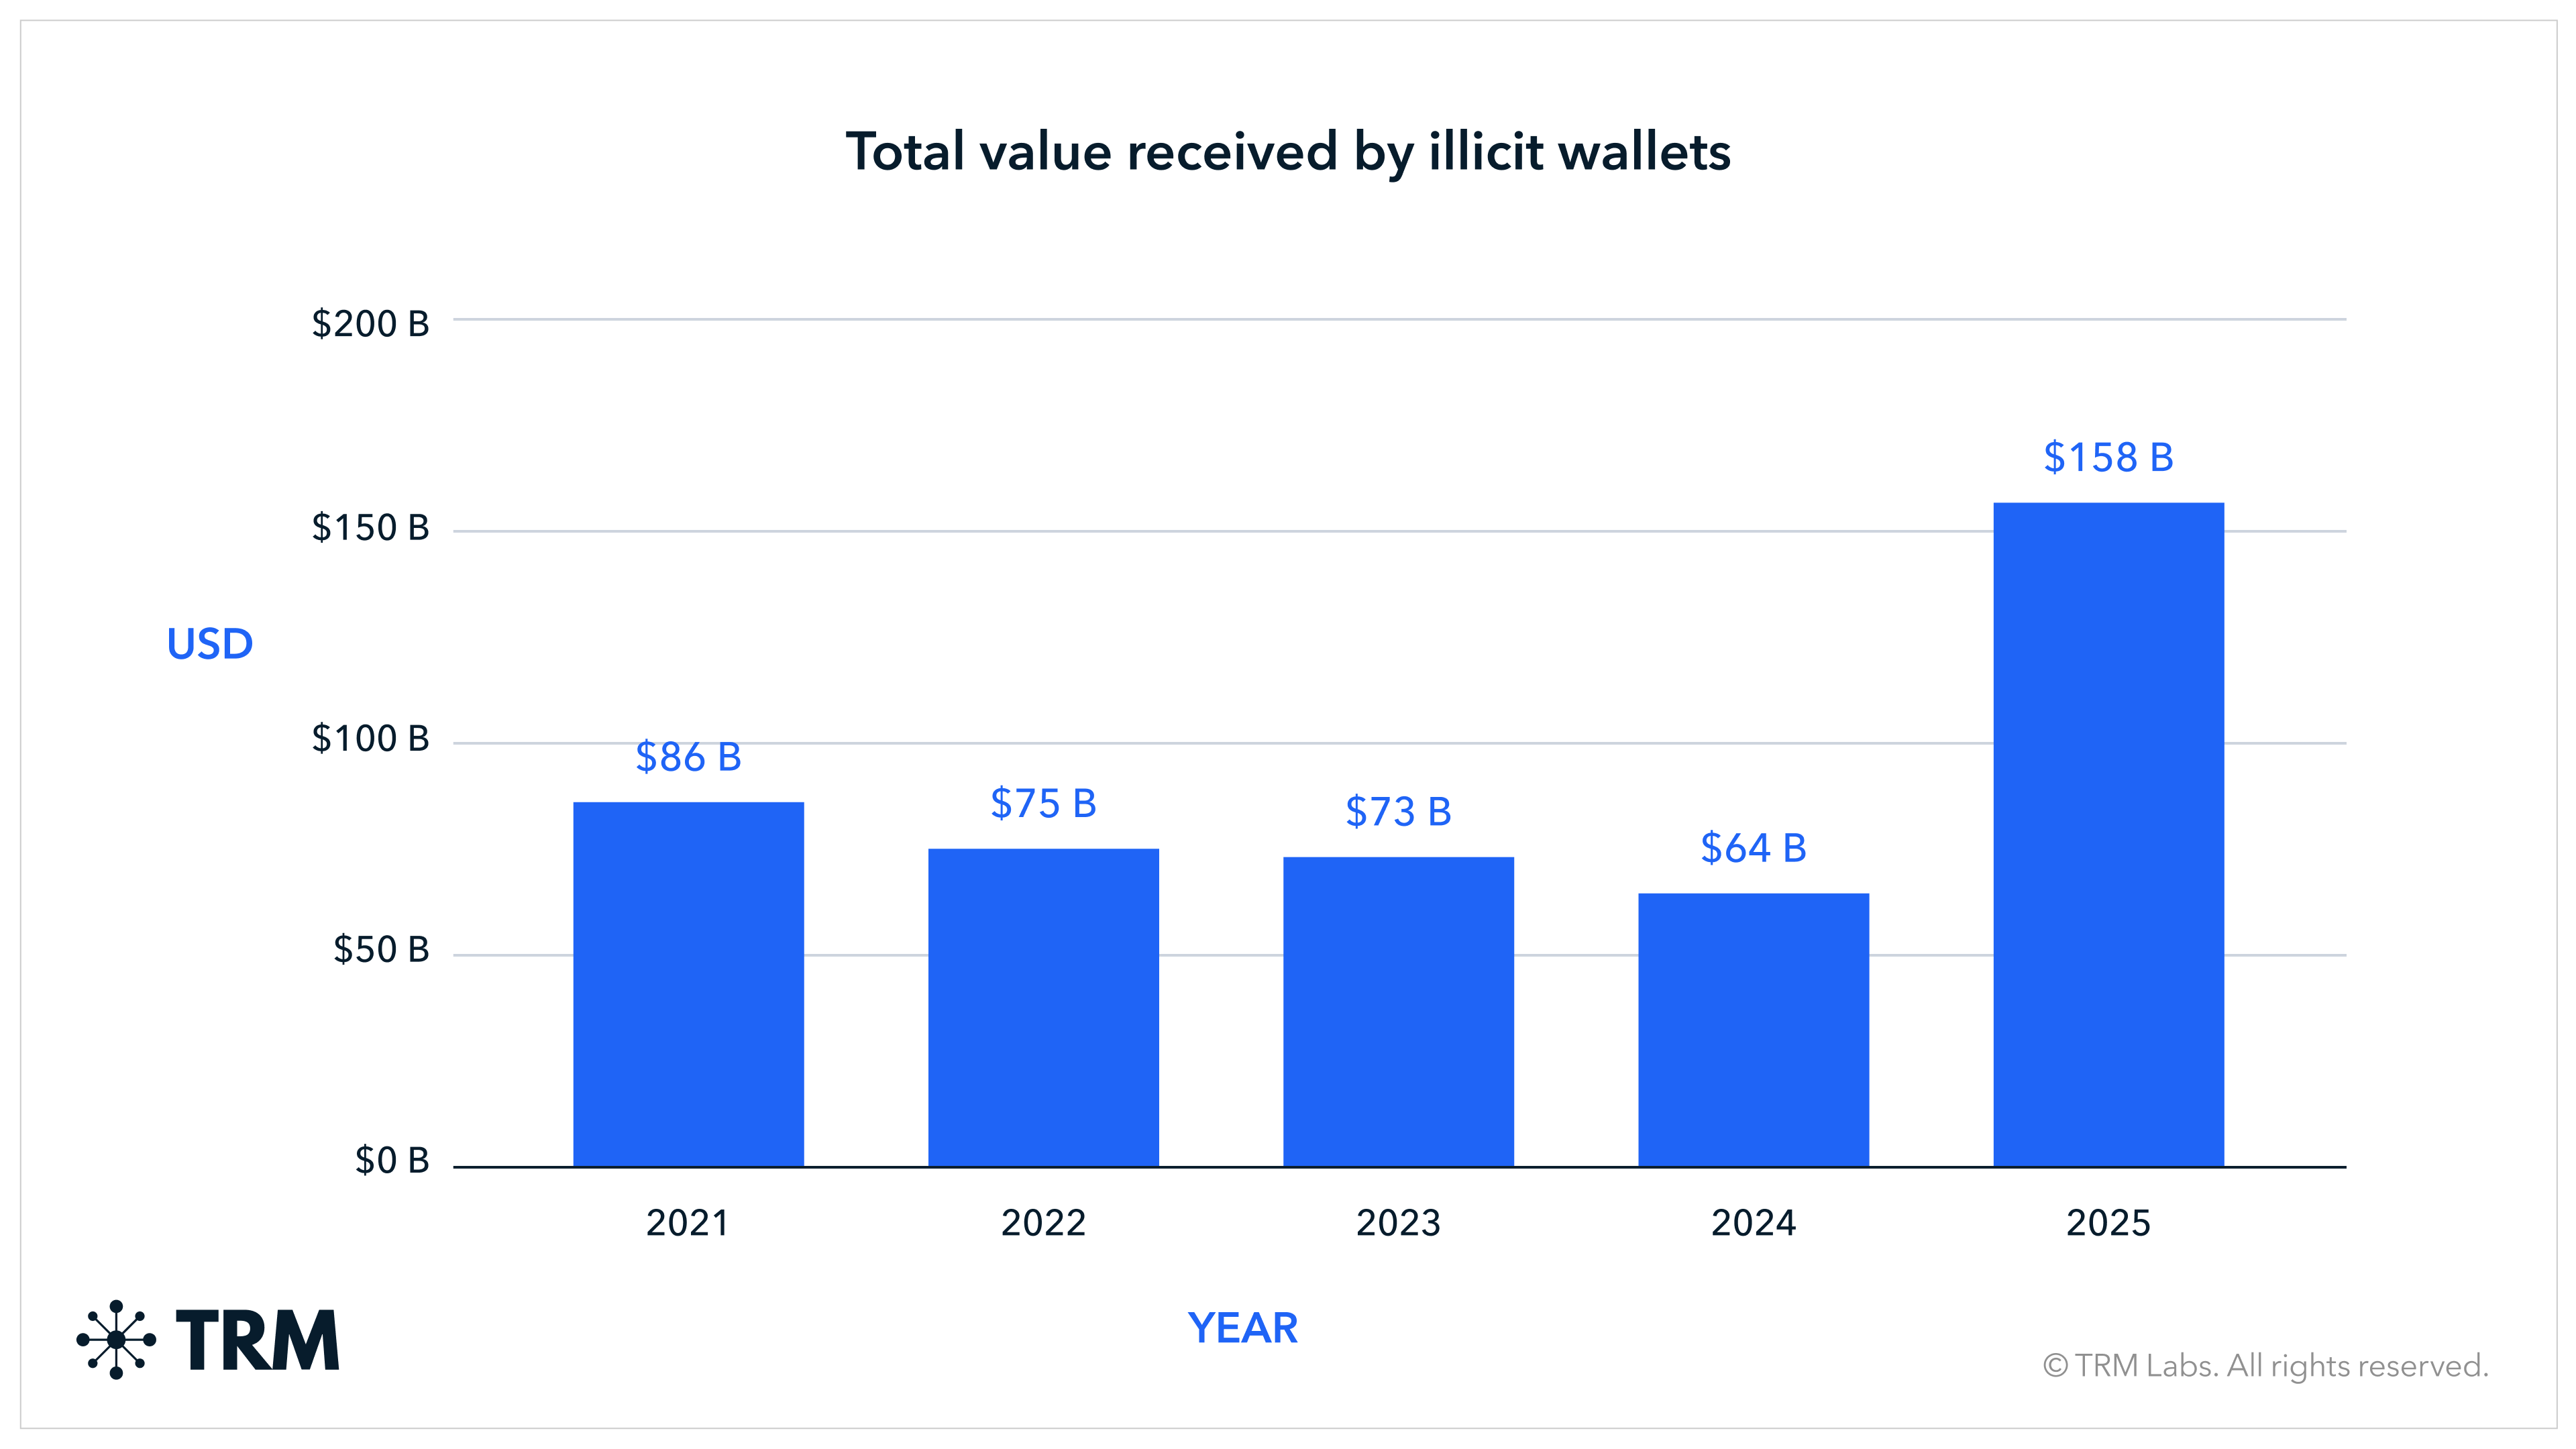
- Illicit crypto volume reached an all-time high of USD 158 billion in 2025, up nearly 145% from 2024.
- Despite the increase in absolute illicit volume, illicit volume as a proportion of overall crypto volume fell in 2025, from 1.3% in 2024 to 1.2% in 2025.
- While illicit activity represented a small share of overall on-chain volume, illicit entities captured 2.7% of available crypto liquidity in 2025, using a new metric that frames risk relative to deployable capital rather than raw transaction volume.
- Sanctions-related activity in 2025 was overwhelmingly driven by Russia-linked flows, largely due to the rapid growth of the ruble-pegged stablecoin A7A5, which processed more than USD 72 billion in total volume. As a sanctioned token, A7A5 demonstrates how sanctions risk now extends beyond individual transactions to the broader ecosystem around an asset, with activity involving the token itself — including its issuers, intermediaries, and counterparties — increasingly viewed as sanctions-linked rather than discrete, isolated events.
- The A7 wallet cluster is associated with at least USD 38 billion in 2025, reflecting concentrated, coordinated activity closely associated with sanctions evasion and state-aligned financial infrastructure rather than broad market usage.
- A small number of large-scale hacks and enforcement-driven attributions accounted for most of the volume increase.
- Major geopolitical players leaned further into cryptocurrency in 2025, using crypto rails as durable financial infrastructure. Iran and Venezuela relied on crypto for sanctions-constrained payments and financial services at scale. Chinese language escrow and money laundering networks processed over USD 100 billion, operating as critical infrastructure for global illicit markets rather than as state-directed activity.
{{horizontal-line}}
These takeaways reflect the current state of the cryptocurrency environment — no longer novel or peripheral, but broadly integrated and, in some cases, deeply embedded in traditional economic activity. Regulators, everyday users, governments, and criminal actors alike now encounter crypto as a routine part of financial life. Crypto tools are easier to use, increasingly seamless, and woven into both legitimate and illicit financial services, while many governments are incorporating digital assets into national economic strategies. The result is a growing baseline fluency with crypto that has, at the same time, improved the detection of illicit activity and enabled larger volumes of value to move through the broader illicit crypto ecosystem.
The percentage of illicit activity represents only a small fraction of overall activity, as has always been the case. However, TRM believes that in the past this has been undercounted. Therefore, we have refined our methodology to reflect that in this year’s report.
Revisiting our methodology: Considering illicit total volumes and illicit activity relative to incoming liquidity
Illicit cryptocurrency wallets received an estimated USD 158 billion in incoming value in 2025, a sharp increase from USD 64.5 billion in 2024 and the highest level observed over the past five years. Prior to this rebound, total incoming value to illicit entities had declined steadily from USD 85.9 billion in 2021 to USD 75.4 billion in 2022 and USD 73.3 billion in 2023, before reaching a low point in 2024.
The change in 2025 reflects a combination of intensified sanctions enforcement, increased use of crypto by nation-state actors, and technological advances such as the Beacon Network — a trusted collaboration framework that connects law enforcement and investigators to share high-confidence intelligence and accelerate attribution and detection.
Despite the increase in absolute value in 2025, the percentage share of illicit activity continued to decline. Measured as a share of total attributed on-chain volume, illicit activity fell slightly to 1.2% in 2025 from 1.3% in 20241, well below the 2023 high of 2.4%.
When we contextualize illicit activity relative to incoming liquidity, a similar trend emerges: illicit entities received 2.7% of incoming VASP flows in 2025, compared with 2.9% in 2024 and 6.0% in 2023. Together, these metrics indicate that while certain illicit categories expanded in absolute terms, illicit actors absorbed a smaller proportion of new capital entering the crypto ecosystem.
{{2026-crypto-crime-report-key-insights-callout-1}}

Russia-linked sanctions designations and improved attribution drove the largest shift in illicit crypto activity
Inflows to sanctioned entities and jurisdictions rose sharply in 2025, led by USD 72 billion received by A7A5 token, followed by an additional USD 39 billion sent to the A7 wallet cluster. This growth was highly concentrated: the vast majority of sanctions-linked volume was connected to Russia-linked entities, including Garantex, Grinex and A7.
The increase is not linked to growth in sanctions evasion activity alone, but also new designations of large entities in combination with improved attribution of cryptocurrency addresses to already sanctioned actors.

{{2026-crypto-crime-report-key-insights-callout-2}}
A7 stands out not only for its scale, but for its role as a centrally coordinated sanctions-evasion and financial-resilience architecture tied to Russian state interests. On-chain activity indicates that A7 functions as a hub connecting Russia-linked actors with counterparties across China, Southeast Asia, and Iran-linked networks, reflecting a deliberate shift toward crypto-enabled, state-aligned financial infrastructure.
While the A7 wallet cluster is closely associated with sanctions evasion activity, the A7A5 token reflects a broader strategy to reduce reliance on USD-backed rails by expanding use of a ruble-pegged stablecoin. As a result, high volumes associated with A7A5 do not exclusively represent sanctions evasion, but rather sanctioned activity more broadly, including state-aligned economic flows. Together, these dynamics illustrate how Russia-linked actors are increasingly leveraging crypto — particularly stablecoins and higher-risk services — as part of a long-term, nation-state-backed sanctions adaptation strategy.
Inflows to sanctioned entities were predominantly using stablecoins. This preference for stablecoins and move to high-risk services reflects the environment of more effective enforcement, expanded use of crypto identifiers in sanctions designations, and increased risk of detection or asset freezing. Together, these dynamics point to a sanctions environment in which authorities prioritize Russia-linked networks; enforcement tools are more crypto-native; and illicit actors adapt by moving to riskier, less regulated channels.
Geopolitics moved on-chain
Geopolitical pressures reshaped illicit crypto activity in 2025, as state and state-aligned actors moved to using cryptocurrency as core financial infrastructure rather than a tool of last resort. While Russia-linked networks largely drove sanctions-related crypto volume, the more consequential shift was the institutionalization of crypto rails by other sanctioned actors.
In Venezuela, for example, crypto functioned as a pressure-release valve in a heavily sanctioned economy where traditional banking access is limited — supporting payments, remittances, and state-linked financial activity.
China occupies a distinct role in the illicit crypto landscape as a hub for illicit financial services infrastructure. TRM analysis showed that activity associated with Chinese-language escrow services and underground banking networks has grown sharply over time, with adjusted crypto volume rising from approximately USD 123 million in 2020 to over USD 103 billion in 2025. This sustained growth reflects the increasing reliance of a wide range of illicit actors, including scam networks, cybercrime groups, and sanctions evasion intermediaries, on escrow-based crypto services for settlement and cash-out across the APAC region.

These services facilitate high-volume stablecoin transactions and bridge crypto assets into the formal financial system through OTC brokers, money mule networks, and APAC-based casinos.
This activity hits on a theme for 2025: the illicit crypto ecosystem is being shaped by its accessibility and integration into everyday financial activity. Globally accessible service providers like these Chinese escrow services enable criminal demand at scale, with stablecoins serving as the primary connective layer between geopolitical actors, intermediaries, and illicit markets.
Crypto crime numbers reached an all-time high
Adjusted total incoming illicit cryptocurrency activity rose to approximately USD 158 billion in 2025, the highest level observed in the past five years, and a sharp increase from USD 64.5 billion in 2024. This reversal followed three consecutive years of decline and reflects a renewed expansion of illicit activity across multiple categories, rather than growth driven by a single event type or market cycle.
Key drivers of this increase include:
- Expanded sanctions-related activity, which grew over 400% year-over-year, alongside continued increases among blocklisted entities (32%) and hacked or stolen funds (31%) — reflecting both large-scale enforcement actions and improved attribution of activity linked to already sanctioned actors.
- More modest growth in market-driven illicit activity, with darknet markets (20%) and illicit goods and services (12%) expanding at a slower pace.
- Improved speed and coordination of attribution through the Beacon Network, which enables earlier identification of illicit activity by connecting trusted law enforcement partners and investigators across jurisdictions. Beacon Network has not expanded what TRM defines as “illicit activity,” but has accelerated how quickly high-confidence intelligence, incident data, and investigative insights are incorporated into our platform — improving visibility into emerging threats and large-scale events as they unfold.
- Growth in blocklisted activity across multiple crime types, driven in part by expanded stablecoin issuer enforcement, particularly by Tether, targeting wallets linked to sanctions evasion, terrorism financing, fraud, and hacking.
Taken together, these dynamics indicate that the 2025 increase in total incoming illicit crypto activity was driven less by broad-based expansion across all illicit activity types and more by concentrated shocks; enforcement-linked developments; and faster, higher confidence attribution, particularly around large-scale hacks and sanctions-related flows.
TRM methodology and approach
Why we are rethinking how illicit crypto activity is contextualized
Illicit cryptocurrency activity has traditionally been expressed as a percentage of total blockchain transaction volume. While this framing offers a convenient high-level reference point, it has meaningful limitations that become more pronounced as crypto markets mature.
Total blockchain volume captures a wide range of activity that does not necessarily correspond to real economic transfers or changes in ownership. High-frequency trading, automated market making, arbitrage, internal exchange flows, and technical behaviors such as funds cycling repeatedly across addresses can materially inflate transaction volume without introducing new capital or increasing the amount of value effectively in circulation.
Although TRM applies techniques to estimate ownership changes and filter out certain internal or self-referential movements, these methods are inherently imperfect. In practice, distinguishing between genuine economic transfers and technical or intermediary-driven activity is increasingly difficult in markets defined by rapid trading, layered infrastructure, and repeated reuse of the same funds across multiple wallets. As a result, total blockchain volume often functions as a noisy denominator — one that can mask the true economic scale and impact of illicit activity rather than illuminate it.
For this reason, TRM has made two changes to this estimate this year:
1. Lower-bound estimate: refining the denominator
For the lower-bound estimate, TRM now constrains the denominator to cryptocurrency activity involving known services, known wallets, and service-like clusters, along with a limited set of clusters that clearly behave like services but lack full attribution. This adjustment is designed to more closely align the denominator with activity that reflects real economic use rather than technical or self-referential movement.
The revised approach intentionally excludes large volumes of activity that inflate transaction counts without representing meaningful transfers of value. This includes wash trading, peel chains, internal exchange movements, and high-frequency arbitrage activity. Such behaviors can generate substantial on-chain volume while introducing little to no new capital and without increasing the amount of value available to users. Their prevalence has grown alongside newer blockchains and trading environments that enable highly automated strategies.
By narrowing the denominator to activity that can be confidently identified and economically contextualized, this methodology produces a more conservative and analytically meaningful baseline for assessing illicit activity. The principal tradeoff is the exclusion of some peer-to-peer and personal wallet activity that does not interact with identifiable services. TRM views this tradeoff as justified, as it prioritizes precision and interpretability over completeness in environments where raw transaction volume can obscure, rather than clarify, economic reality.
2. Illicit activity as a share of VASP outflows
TRM is introducing a new metric that frames illicit activity as a share of VASP outflows, rather than as a share of total on-chain transaction volume. This approach reflects our view that illicit risk is better understood relative to available liquidity than to aggregate blockchain activity. In this report, we approximate available liquidity using the USD value of funds leaving virtual asset service providers. VASP outflows represent the point at which value exits custodial environments and becomes freely deployable across the on-chain ecosystem, where it can be transferred, converted, and used for a wide range of purposes, including illicit activity.
A simplified example illustrates the distinction. Imagine USD 100 entering the on-chain ecosystem from exchanges over a given period. That same USD 100 may circulate extensively — moving through trading venues, wallets, bridges, and smart contracts — generating hundreds or thousands of dollars in transaction volume as it is reused. If USD 20 of that value ultimately flows to illicit wallets, measuring illicit activity as a share of total blockchain volume would yield a very small percentage, even though 20 percent of newly available capital was absorbed by illicit actors. Framing illicit activity as a share of the USD 100 in available liquidity, by contrast, more clearly reflects the economic significance of that absorption.
This liquidity-based framing better aligns with how illicit networks operate in practice. Illicit actors are constrained not by transaction counts, but by access to transferable value that can fund operations, payments, and downstream networks. By anchoring the denominator to funds leaving VASPs, this metric focuses on the pool of capital that is realistically accessible for use, rather than on technical transaction activity driven by market structure, trading strategies, or internal system behavior.
We do not suggest that VASP outflows capture all sources of liquidity, nor that every outflow represents newly introduced capital. However, as a consistent and observable baseline, available liquidity provides a more stable and economically meaningful context for assessing illicit activity than total blockchain volume alone. Used alongside traditional measures, this approach offers a clearer and more intuitive view of how illicit actors participate in — and draw value from — the crypto ecosystem.
How we calculated total illicit volumes
TRM’s estimate of total illicit cryptocurrency volume is based on the USD value of funds stolen through crypto-native hacks, combined with the USD value of transfers to blockchain addresses on Bitcoin, Ethereum, TRON, Binance Smart Chain, and Polygon that TRM has attributed to illicit entities. These entities include a broad range of threat categories, such as fraud schemes, sanctioned actors, terrorist organizations, and darknet marketplaces.
We treat this estimate as a conservative baseline — a minimum, or “floor,” for illicit cryptocurrency activity. Illicit activity on blockchains is frequently identified with delay, as attribution improves over time through law enforcement actions, sanctions designations, judicial proceedings, and open-source reporting. As new intelligence emerges and additional wallets are linked to known illicit actors, historical estimates often increase, reinforcing the view that initial measurements understate the true scale of illicit activity at the time it occurred.
Several categories of activity are intentionally excluded from this estimate.
- First, we exclude proceeds from crimes that originate in fiat currency and are later converted into cryptocurrency. These flows typically enter the crypto ecosystem through on-ramps and payment intermediaries and are difficult to identify using on-chain data alone. Accurately estimating this activity would require supplementary information from VASPs and national financial intelligence units that is not consistently available.
- Second, we exclude transfers to blockchain addresses that have not been attributed to illicit activity. While unattributed addresses may include illicit actors, they also encompass a large volume of legitimate activity. Where relevant, we estimate an upper bound for such activity by examining transactions involving unattributed addresses that do not appear to represent internal transfers within a single entity.
- Third, our estimate excludes the laundering of illicit crypto proceeds. The illicit volume metric is intended to capture the revenue generated by illicit actors, not the subsequent movement of those funds through laundering chains. When calculating illicit crypto volume as a share of overall blockchain activity, we focus on incoming transaction volume to attributed illicit entities and exclude transfers that appear to be internal to a single entity, such as peeling chains or certain decentralized exchange swaps.
Disclaimer: Overall illicit volume figures are likely to be revised upwards
These figures reflect TRM’s current estimates of illicit cryptocurrency volume based on the best available intelligence at the time of publication. However, detecting and attributing illicit activity is inherently complex and often occurs with delay. As investigations progress, new sanctions are issued, cases are unsealed, and additional information becomes public, previously unknown wallets and transactions are frequently linked to illicit actors.
As a result, overall estimates of illicit volume tend to increase over time. Readers should therefore view the figures in this report as a dynamic baseline rather than a fixed measurement. This expectation of future upward revision applies both to our current methodology and to prior estimates, reflecting the evolving nature of attribution and the continual incorporation of new intelligence.
This blog features key highlights from TRM’s 2026 Crypto Crime Report.
{{horizontal-line}}
Frequently asked questions (FAQs)
What is the estimated total of illicit crypto flows in 2025?
TRM Labs estimates that illicit cryptocurrency flows reached USD 158 billion in 2025 — the highest level observed in the past five years. This marks a nearly 140% increase from 2024.
How does TRM define “illicit crypto activity”?
TRM defines illicit activity as funds received by blockchain addresses attributed to threat categories such as fraud schemes, sanctioned entities, terrorist organizations, and darknet markets. These estimates exclude fiat-originated crimes, unattributed addresses, and laundering flows, ensuring a conservative and defensible baseline.
Why did illicit crypto volumes increase in 2025?
The 2025 increase was driven by a combination of factors:
- Expanded sanctions designations (especially Russia-linked entities)
- Improved attribution through tools like TRM’s Beacon Network
- A small number of large-scale hacks
- Increased use of crypto by state-aligned actors including Iran and Venezuela
How is TRM calculating illicit activity differently this year?
TRM introduced two key updates to its methodology:
- Lower-bound estimate: We now exclude technical or non-economic flows (e.g. wash trading, peel chains) to focus on real economic activity.
- Illicit activity as a share of VASP outflows: This frames risk relative to available liquidity rather than raw blockchain volume, offering a more intuitive view of capital absorbed by illicit actors.
What role did stablecoins play in illicit activity in 2025?
Stablecoins were central to illicit flows:
- The vast majority of inflows to sanctioned entities were in stablecoins.
- Top stablecoins included USDT and Russia’s ruble-pegged A7A5.
- Stablecoins served as the primary layer for value transfer across sanctioned jurisdictions, underground banking networks, and illicit service providers.
How is TRM’s Beacon Network improving attribution?
The Beacon Network enables trusted collaboration between law enforcement and investigators, accelerating the detection and attribution of illicit activity. It does not change the definition of illicit activity, but it improves how quickly and confidently new insights are surfaced and incorporated into TRM’s intelligence.
How likely are these figures to change?
TRM’s estimates represent a conservative baseline. Due to delays in attribution, figures are expected to be revised upward over time. This has occurred in previous years — for example, TRM's estimate for 2023 rose from USD 34.8 billion at publication to over USD 58 billion as new data emerged. Readers should treat these numbers as a dynamic baseline, not a static total.
What does this mean for compliance and law enforcement teams?
The rise in illicit flows — especially those involving stablecoins, sanctions, and large-scale infrastructure — signals the need for:
- Faster attribution tools and cross-jurisdictional collaboration
- Monitoring of non-custodial infrastructure (e.g. no-KYC DEXs, escrow services)
- Intelligence-led approaches that focus on liquidity risk, not just transaction counts